






Zero-Downtime Migrations, Tested
Lock queues, expand and contract and rolling restarts, measured on Postgres 16 and 17 and nginx
Abstract
A one line ALTER TABLE runs in milliseconds, yet it can stall every query on the table for as long as an unrelated transaction stays open. This paper measures that on PostgreSQL 16.15 and 17.11 with a pgbench workload at a fixed rate, then tests lock_timeout with retry, changes that rewrite or scan a table, concurrent indexes, NOT VALID constraints, a rename done in one step versus expand and contract, and a rolling restart behind nginx 1.27.2. A queued ADD COLUMN stalled all reads for about 5 s, and lock_timeout cut each stall to about the timeout. An ordered procedure is derived from the steps, not measured as a whole. The database ran on tmpfs with scaled data, so every time is a shape, not a production time. Replicas, managed services, Kubernetes and migration tools were not tested. The harness and raw results are published at release.
Keywords
- zero downtime migration
- Postgres lock queue
- lock_timeout retry
- expand and contract
- CREATE INDEX CONCURRENTLY
- NOT VALID constraint
- rolling restart
- connection draining
At a glance
- Problem
- Migration advice is a list of rules, each documented alone. Among the sources read, none measures a lock queue, a retry and an expand and contract change together.
- What this paper adds
- Measured stalls and failures for each hazard on Postgres 16 and 17 and nginx, an ordering built from them (not run as a whole), and a rerunnable harness. Lab shape: tmpfs, scaled data.
- Who it is for
- Engineers running Postgres behind a web app with a few instances and a reverse proxy, without a dedicated database team.
- How to use it
- Use the cost classes in chapter 4 and the procedure in chapter 8 to plan your next migration, and the harness to test your own table.
Key findings
A queued ALTER stalls every reader.
An ADD COLUMN behind a 6 s open transaction stalled all reads for about 5 s and raised p99 from about 4.5 ms to 4.9 s. With no long transaction it took under 1 ms.M Argued in Ch. 2
lock_timeout bounds the stall, and the retry lands the change if the blocker ends first.
With a 6 s reader, timeouts of 200, 1000 and 3000 ms cut the longest read stall to about 0.21, 1.0 and 3.0 s, against 5.0 s with none.M Argued in Ch. 3
A volatile default rewrites the table.
On 3 million rows, a constant default took under 1 ms with no rewrite. A volatile default took about 1 s, grew the table from 298 to 321 MB and stalled reads as long.M Argued in Ch. 4
CONCURRENTLY nearly removes the write stall.
On 2 million rows under updates, a plain CREATE INDEX stalled writes about 1.2 s and CREATE INDEX CONCURRENTLY about 0.03 s, with no failed requests.M Argued in Ch. 5
A one step rename breaks the old app version.
A single RENAME COLUMN made all 6 old-version clients fail. Expand, batched backfill and an overlap of both versions gave 0 failed requests over about 23000 transactions (clients aborted at their first error, lab). The contract mostly ran after the clients stopped.M Argued in Ch. 6
Drain before you stop.
Behind nginx 1.27.2, killing one of two replicas failed 12 of 1920 requests, SIGTERM without leaving the proxy 1, and removing it, waiting, then stopping it 0. Docker and nginx, GET requests only.M Argued in Ch. 7
Cite as
GLINR Studios. (2026). Zero-Downtime Migrations, Tested: Lock queues, expand and contract and rolling restarts, measured on Postgres 16 and 17 and nginx (Working paper No. GLINR-WP-2026-501, Version 0.1.0). https://glinr.com/research/2026-501-zero-downtime-migrations
Disclosure
GLINR Studios builds Levelrail, a self-hosted deployment platform. No product is recommended in this paper. PostgreSQL and nginx appear only as test subjects, with versions.
No external funding. This is the studio's own open-source work, paid for by the studio.
Claim labels
Each claim carries a small tag that says how it is known.
- M
- Measured by us
- S
- Sourced from a primary source
- D
- Derived, arithmetic shown
- O
- Opinion
- E
- Estimate
Rights
Copyright 2026 GLINR Studios. Licensed CC BY 4.0: share and adapt with attribution. Sourced claims cite the references. creativecommons.org/licenses/by/4.0/
Key takeaways
What each chapter ends on, in one place.
Chapter 1: One line of SQL, fifteen seconds of outage
- A one line DDL has two clocks, and rehearsal on a copy measures only the one that is cheap.
- In this lab an ALTER that ran in 0.3 ms stalled every reader for about 5 seconds behind a 6 second transaction, and an idle in transaction session did the same.
- Zero downtime here means no failed request and no stall above 1 s during each step, not the absence of a maintenance page.
Chapter 2: Locks and the queue
- Most
ALTER TABLEforms ask for ACCESS EXCLUSIVE, and a waiting request blocks every conflicting request behind it, so the wait costs more than the change S M. - In this lab an ADD COLUMN behind a 6 s transaction stalled all reads for about 5 s, and with no such transaction it stalled nothing M.
- An idle in transaction session blocked the ALTER for the same 5 s as an active one, and the only primary evidence here is the documentation of
pg_blocking_pidsplus our E1 S M.
Chapter 3: lock_timeout and retry as a protocol
- A timeout bounds the stall, it does not remove it: about the timeout, once per attempt, in this lab.
- The migration lands after the blocker ends, in a bounded number of attempts, or it gives up and says so.
- Add the loop to the runner with a retry only on the lock error, a pause, and a hard bound. A silent give up is a bug.
Chapter 4: Metadata only, scan, or rewrite
- Cost class decides how long the lock is held. The lock level decides who is blocked.
- One word in a default moved
ADD COLUMNfrom 0.6 ms to about 1 s in this lab, and the readers stalled for the same second. - The lab ran one table size. The shape is the class, not a scaling law.
Chapter 5: Indexes, constraints and backfills
- Add the index with
CONCURRENTLY, outside a transaction, and watch for old sessions: the build waits for them, and a failed build leaves an INVALID index to drop. - Add a foreign key or CHECK as
NOT VALID, thenVALIDATE. GetSET NOT NULLcheap by validating a CHECK first. - Fill data in short batches outside the schema migration, and measure the batch size on your own system.
Chapter 6: Expand and contract with two app versions
- Only the contract step makes old version queries fail in this rename, so it goes last and waits for the last old process to exit.
- In this lab a one step rename aborted all 6 old clients at their first error, and the four step path had 0 failed requests over about 23000 transactions per repetition, with the contract itself mostly run after the clients stopped.
- The lab covered one rename and no pgroll arm, so it supports the shape of the pattern and nothing about your schedule or your table size.
Chapter 7: Draining on a rolling deploy
- Three events race on a shutdown: the router stops sending, the process gets SIGTERM, the kill timer fires. Fix the order, not the timeout.
- In the lab, kill failed 12 of 1920, stop without deregister 1, deregister then stop 0.
- Proxy retry made GET failures vanish and is unsafe for non idempotent requests. Kubernetes and load balancer behavior here is documentation, not measurement.
Chapter 8: One procedure: migrate, deploy, roll back
- Schema first, app second, cleanup last. Rollback is only clean before the contract step.
- Every blocking step gets its own timeout and bounded retry, because a waiting ALTER stalls every reader behind it (E1, E2).
- This paper measured the parts, not the whole. The capstone run was not done.
Chapter 9: Tools, and what they cannot see
- Run a linter if you have one, but do not read a clean report as a safe migration. It has not seen your traffic.
- Put
lock_timeoutwith bounded retry in the runner, andidle_in_transaction_session_timeouton the server. Neither is a property of the migration text. - Measure the cost class of your own change on your own table before you trust a time from this paper.
Contents
Revision 0.1.0, November 2026
Preface§
Migration advice usually arrives as a list of rules: set a lock timeout, add the index concurrently, never rename a column in one step. Each rule is documented. What is rarely shown is what breaking one costs, and how the rules interact once a real workload and a rolling deploy are running. In our lab, an ADD COLUMN that ran in under a millisecond on its own stalled every read on the table for about 5 s once it queued behind a 6 s open transaction [1]M.
So this paper measures the steps, one at a time, and then orders them. The lab is small: PostgreSQL 16.15 and 17.11, a pgbench workload at a fixed rate, and a rolling restart of two replicas behind nginx 1.27.2. That limits what we can say. The data directory sat on tmpfs and the tables are scaled down, so every time is a shape, not a production time. Replicas, very large tables, managed services, Kubernetes and migration tools were not tested, and where the text touches them it quotes documentation and says so.
We wrote it for the engineer who runs Postgres behind a web app with one to a few instances and a reverse proxy, and who ships schema changes without a database team. You need psql and a shell. It is not aimed at MySQL, sharded or multi-primary setups.
Chapter 1
One line of SQL, fifteen seconds of outage§
The question: How can a change that runs in a fraction of a millisecond take an API down?
GoCardless describes the incident this way. A migration needed an ACCESS EXCLUSIVE lock on a table. A long running SELECT already held a conflicting lock, so the migration queued behind it, and the queries that arrived after the migration queued behind the migration. The company reports about 15 seconds of API downtime [2]S. It also reports that the same migration, replayed on a backup, took a few hundred milliseconds [2]S.
Read those two numbers together. The statement was cheap. The outage was not, so whatever cost the API 15 seconds, it was not the work the ALTER did.
We have one first-party incident account for this paper, and we will not stretch it into a trendO. The page carries no publication date in the text we read, so we print only the access date, 2026-11-11. The account gives a hypothesis with a mechanism. The rest of the paper tests it, and then tests what you can do about it.
1.1 Two clocks§
A schema change has two clocks. The first is how long the statement runs once it holds its lock. The second is how long it waits to get that lock. Rehearsal on a copy of production measures the first clock and is blind to the second, because a copy has no long transaction running against it at the moment you tryD.
The GoCardless figures fit this model. A few hundred milliseconds is the first clock, measured on a backup. About 15 seconds is what users felt, and the account attributes it to the queue [2]S. Users feel the sum of both clocks plus the time everyone else spends waiting behind you. They rarely feel the first clock alone.
A rehearsal on a copy measures how long the lock is held. Your users feel how long it is waited for.
The second clock is not under the migration’s control. It belongs to whichever transaction happens to be open on the table, whether it is a report, a forgotten session in a psql window, or an application that opened a transaction and went to call another service. Chapter 2 explains why the wait spreads to unrelated queries. This chapter only reproduces it.
1.2 Reproduction§
We ran the scenario on a small lab rather than rely on one account. The setup was thisM. PostgreSQL 16.15 and 17.11 in Docker, with the data directory on tmpfs so that disk speed is not part of the result. One table of 100 thousand rows. A pgbench client set at a fixed arrival rate of about 500 transactions per second with 8 clients, all plain reads on that table. Session A opened a transaction, read the table and stayed open for 6 seconds. One second later session B ran ALTER TABLE t ADD COLUMN c int. We repeated each arm 6 times in total, 3 in each of 2 complete runs [1]M.
The measured shape is in the table. Every figure is a lab figure on a RAM backed data directory and a scaled table, and none of them is a time to expect in production.
| In this lab, median | PostgreSQL 16.15 | PostgreSQL 17.11 |
|---|---|---|
| Stall, ALTER behind a 6 s transaction | 5.008 s | 5.012 s |
| p99 latency, no DDL | 4.45 ms | 4.59 ms |
| p99 latency during that stall | 4862 ms | 4890 ms |
| ALTER with no long transaction, run time | 0.37 ms | 0.31 ms |
| Reader stall, ALTER with no long transaction | 0.023 s | 0.024 s |
| Reader stall, no DDL at all | 0.020 s | 0.022 s |
Stall is the longest gap, in seconds, between two consecutive completed transactions in the load generator’s log [1]M. At 500 transactions per second a run with no DDL shows about 0.02 s. The result agreed in both runs on both versions. One of the six PostgreSQL 17.11 repetitions stalled for 5.9 seconds and the rest stalled for 5.0 [1]M.
Three things stand out. One: the stall is about 5 seconds, which is the 6 second transaction minus the 1 second head start, so it tracks the reader and not the DDL. Two: the ALTER that did all this damage ran for 0.3 to 0.4 milliseconds when nothing was in its way, and in that arm the readers stalled for as long as they did with no DDL at all [1]M. Three: the reads that suffered were plain SELECTs, which on their own never conflict with each other [3]S.
1.2.1 A worked example of the cost§
At a fixed arrival rate of 500 transactions per second, a 5 second stall leaves about 2500 scheduled transactions with nowhere to runD. The client does not drop them. They wait, and the latency pgbench records includes that waiting, which is why p99 jumped from about 4.5 ms to about 4.9 seconds rather than staying near the normal figure. A request that arrived at the start of the stall waited nearly the whole of it. Read p99 as what a queued request experienced, because that is what it is.
A real service adds more on top: client timeouts that fire during the stall, retries that add load when it ends, and connection pools that fill with sessions all waiting on the same lock. We did not model any of that. The 2500 is arithmetic on our own load setting, not an estimate of anybody’s traffic.
1.3 Which long transaction§
A transaction need not be doing anything to cause this. We also left session A idle in a transaction after one read, doing nothing at all. The ALTER waited 5.0 seconds behind it, as it did behind the active one: 5010 ms on 16.15 and 5000 ms on 17.11 [1]M. The lock is held by the open transaction, not by the query inside it.
The usual suspects here are not slow queries. An application that begins a transaction and then makes an HTTP call to another service holds locks the whole time it waits. A debugging session left open overnight holds them too. A check that looks only at slow queries misses both.
1.4 What this paper means by zero downtime§
The phrase gets used loosely. In this paper zero downtime means no failed client request attributable to the change and no gap above 1 s between completed transactions during the step, as measured by the load generatorD. The 1 s bound is our choice, not a standard, and the chapters say which arms meet it. A maintenance page that never appeared is not the test. A stall that holds every reader for 5 seconds is a failure by this definition even though nothing returned an error.
Two limits go with the definition. First, pgbench stops a client at its first error, so a failed request in the measurements to come is that first error, not an error rate. It tells you how many clients hit an error. It does not tell you what share of requests failed, and we never present it as one [1]M. Second, the 1 s bound applies to the stall as defined above, and a single repetition over it fails the arm for that repetition.
GitLab holds itself to a strict rule. Its migration style guide says migrations are not allowed to require installations to be taken offline, ever. That is a living document, read on 2026-11-11 [4]S. The rule has a cost, and the cost is the subject of the chapters that follow: every step must be shaped so that its lock is short or its lock is weak.
1.5 What was not measured§
The reproduction has narrow edges. It ran on one laptop that did not meet the quiet gate: the one minute load average on the 14 core host was between 4 and 27 across the runs, so short stalls and p99 are noisy and the 5 second stall is the robust part [1]M. The table was 100 thousand rows. No replica was present. No managed service was tried. The workload was reads, with a single ALTER form. We did not reproduce the 15 second outage itself, because we have no way to rebuild their traffic, and we do not claim that 15 seconds is typical. One incident plus a reproduction shows that the mechanism exists and what shape it has. It does not tell you how often your system hits it.
GoCardless gives one piece of advice in answer, which is to set a lock_timeout the application can tolerate [2]S. Chapter 3 tests what that does and what it costs, and chapter 2 first shows why the queue behind a waiting ALTER forms at all.
1.6 Prove it on your own copy§
Run the reproduction once on a staging database and write down the stall. You need two sessions and any load that reads the table. In the first, run BEGIN; SELECT count(*) FROM t; and leave it open. In the second, run ALTER TABLE t ADD COLUMN c int; and notice that it does not return. In a third, run SELECT 1 FROM t LIMIT 1; and notice that it does not return either. Commit the first session and watch all three finish together. The time between starting the ALTER and the commit is your stall. Your own number is worth more than ours, which came off a RAM disk.
Chapter 2
Locks and the queue§
The question: Which DDL blocks which statement, and why does waiting block everyone behind it?
In the model of chapter 1: the wait clock, the one users feel.
A migration holds a lock for as long as it runs, which is usually short. The part that hurts is the time spent asking for it. This chapter has two halves. The first is the lock modes, which come from the PostgreSQL documentation and which we only report. The second is the queue, which the documentation barely describes, and which we reproduced.
2.1 Which lock a change asks for§
PostgreSQL has eight table lock modes [3]S. The two ends matter here. A plain SELECT takes ACCESS SHARE. Of the eight modes, only ACCESS EXCLUSIVE conflicts with it, so only a statement that asks for ACCESS EXCLUSIVE can block a read [3]S. That is the mode the ALTER TABLE page names as the default: most forms of ALTER TABLE take ACCESS EXCLUSIVE unless the page says otherwise, and when one statement has several subcommands the strictest lock among them applies [5]S. So the one line ALTER TABLE t ADD COLUMN c int asks for the lock that conflicts with every other statement on the table, including a read.
The other modes a migration uses are weaker. CREATE INDEX CONCURRENTLY and VALIDATE CONSTRAINT take SHARE UPDATE EXCLUSIVE, and a plain CREATE INDEX takes SHARE [3, 5, 6]S. We only list those here, and chapter 5 measures what they do to writers.
| Statement | Lock mode | Blocks a plain SELECT? |
|---|---|---|
plain SELECT | ACCESS SHARE | no |
most ALTER TABLE forms | ACCESS EXCLUSIVE | yes, the only mode that does |
CREATE INDEX | SHARE | no |
CREATE INDEX CONCURRENTLY, VALIDATE CONSTRAINT | SHARE UPDATE EXCLUSIVE | no |
The documentation tells you which statement is dangerous. It does not tell you what happens to the statements that arrive after it.
2.2 The queue§
Suppose one session has run a SELECT inside a transaction and has not committed. It holds ACCESS SHARE on the table until it commits or rolls back, even if it never touches the table again. Now an ALTER arrives and asks for ACCESS EXCLUSIVE. It conflicts with the held lock, so it waits. The ALTER has changed nothing yet. It is only standing in line.
Then a plain read arrives. By the conflict table it would be fine: ACCESS SHARE does not conflict with ACCESS SHARE, and the ALTER holds nothingD. But the read does not get the lock. It waits behind the ALTER. So does the next read, and the next write. The ALTER is blocked by the open transaction, and everything else is blocked by the ALTER.
The PostgreSQL documentation gives this a name, in the page for pg_blocking_pids. A session is hard blocked if it waits for a lock that another session holds, and soft blocked if it waits only because another session ahead of it in the lock queue wants a conflicting lock [7]S. In the example, the ALTER is hard blocked by the open transaction and every later read is soft blocked by the ALTER. Citus said it in 2018: every lock in PostgreSQL has a queue [8]S. Xata’s walkthrough shows the same sequence: a long SELECT holding ACCESS SHARE, an ALTER waiting for ACCESS EXCLUSIVE, and later SELECT and INSERT statements queueing behind the ALTER [9]S. The Citus post is a practitioner source and the Xata post is a vendor blog, so treat both as attributed statements.
2.3 E1: what the queue costs§
We reproduced the queue on PostgreSQL 16.15 and 17.11 in Docker, with the data directory on tmpfs and a 100 thousand row table [1]M. A pgbench client ran plain reads against the table at a fixed 500 transactions per second with 8 clients. One second in, a second session opened a transaction, ran a SELECT and held it for 6 seconds. One second after that a third session ran ALTER TABLE t ADD COLUMN c int. We repeated each arm 6 times in total, 3 in each of two complete runs. The laptop did not meet the quiet gate: its one minute load average ran between 4 and 27 on 14 cores, so the stall numbers below are a lab shape and not times to expect in production.

Stall is the longest gap, in seconds, between two consecutive completed transactions in the load generator’s log, and a run with no DDL shows about 0.02 s. Latency counts the time a request waits, so p99 is what a queued request experienced.
| Arm | Version | ALTER wait | Stall | p99 |
|---|---|---|---|---|
| no DDL (baseline) | 16.15 | none | 0.020 s | 4.45 ms |
| 17.11 | none | 0.022 s | 4.59 ms | |
| ALTER, no long transaction | 16.15 | 0.37 ms | 0.023 s | about 5.7 ms |
| 17.11 | 0.31 ms | 0.024 s | about 5.2 ms | |
| ALTER behind active transaction | 16.15 | 5006 ms | 5.008 s | 4862 ms |
| 17.11 | 5009 ms | 5.012 s | 4890 ms | |
| ALTER behind idle in transaction | 16.15 | 5010 ms | 5.014 s | about 4.87 s |
| 17.11 | 5000 ms | 5.002 s | about 4.87 s |
Three things stand out. The stall tracks the other transaction and not the DDL. The ALTER waited about 5.0 s, which is what remained of the 6 s hold after the one second lead in M. The ALTER’s own cost, measured in the control arm below, is a fraction of a millisecond. Readers were stalled for the same 5 s, and p99 went from about 4.5 ms to about 4.9 s, on both versions in both runs M. Nobody ran a conflicting statement against those readers. They were behind the ALTER. The control confirms the cause. The same ADD COLUMN with no long transaction took 0.37 ms on 16.15 and 0.31 ms on 17.11 and stalled readers for 0.023 s and 0.024 s, the same as the arm with no DDL at all M. The statement is cheap. The wait is not.
Sessions were sampled once, 2 s after the ALTER started, and nine were waiting on a lock in every repetition on both versions: the ALTER and the readers queued behind it. That is one sample and not a peak over time, so read it as “about 9, sampled once” M.
2.3.1 The holder does not have to be doing anything§
A long SELECT is the textbook case, but the holder of the blocking lock does not need to be running. In a second arm the session ran its SELECT and then sat idle in transaction for the 6 s without committing. The ALTER queued behind it just the same: readers stalled for 5.014 s on 16.15 and 5.002 s on 17.11, with p99 near 4.87 s on both, the same as behind an active transaction. The idle in transaction session was seen in every repetition M. This is the version that is easy to miss in production: it is a connection that a client opened a transaction on and then left aloneO. The PostgreSQL documentation describes idle_in_transaction_session_timeout as a way to stop idle sessions from holding locks [10]S, and chapter 3 returns to what to do about it.
2.4 A timeline you can check against your own incident§
Here is the E1 arm in the order things happened. The times are the lab’s, and the arithmetic is oursD.
| Time | What happens |
|---|---|
| 0 s | Reads run at 500 per second, nothing waits. |
| 1 s | Session A runs a SELECT in a transaction and holds ACCESS SHARE for 6 s. |
| 2 s | Session B asks for ACCESS EXCLUSIVE and queues behind A. From here every new read queues behind B. |
| 4 s | One sample of the waiting sessions: 9, which is B plus the 8 pgbench clients, each stuck on one readD. |
| 7 s | A ends. B gets the lock, finishes in a fraction of a millisecond and releases it. The reads drain. |
The 8 clients also explain why the app falls over and not only slows down. Each client is stuck on one read, so none sends another. Throughput goes to nearly zero for the stall and latency measured from arrival time grows with every second, which is why p99 lands near the stall length M. With a connection pool in front of a real app the effect is the same: all the connections you own fill with queued workO. We did not test a pool.
2.5 Two habits that follow§
Read every migration for the lock it asks for before you read it for what it does. A change that reads as one harmless line can ask for ACCESS EXCLUSIVE, and the question to ask is not how long the statement takes but who may be holding something on that table when it startsO. Treat a long or idle transaction on a table you are about to alter as a block that is already in place. In E1 the idle session was as effective as the active one, so a quiet connection is not a safe one.
You can check the claim on your own staging copy in a few minutes. Open a transaction in one psql session and run a SELECT on a test table. In a second session run an ALTER TABLE on it and watch it hang. In a third, run a plain SELECT on the same table and watch that hang too. Then commit the first session and see both finish at once. The one sentence you will have verified is the one the documentation leaves outO.
2.6 Why the weaker modes behave differently§
The queue effect comes from the mode requested, not from ALTER TABLE as such. Only ACCESS EXCLUSIVE conflicts with a plain SELECT [3]S, so a statement that asks for SHARE UPDATE EXCLUSIVE, such as CREATE INDEX CONCURRENTLY or VALIDATE CONSTRAINT, does not put plain reads behind it by that routeD. That is the reason chapter 5 splits a heavy change into a cheap strong step and a long weak step. We did not run a queue experiment on the weak modes. What we did measure for them is in chapters 4 and 5, where the question is what they do to writers once they hold the lock.
The same logic makes the stall uneven across your tables. A table nobody reads in a transaction will let the ALTER through in a fraction of a millisecond, as the control arm did. A table that sits behind a reporting query, a batch job or a client that opens transactions and forgets them will queue every time. Both kinds of table take the same one line.
2.7 How to read a queue§
During a stall, ask who is at the front of the line. Start from the sessions that are waiting on a lock and follow pg_blocking_pids upward: a reader’s blocker list will name the ALTER, and the ALTER’s list will name the session at the head, which is the one that holds the conflicting lock. That session is the one to look atO. Cancelling the waiting ALTER removes the queue in front of the readers, and ending the holder lets the ALTER finish. Which of the two is right depends on whether the migration or the old transaction matters more at that moment, and no documentation can decide that for you. In E1 the transaction ended by itself after 6 s, so we did not test either cancelO.
2.8 See it before you fix it§
You can watch the queue form. pg_blocking_pids(pid) returns the sessions blocking a given session, and by the documentation’s definition it lists hard blockers and soft blockers alike [7]S. The page also says that calling it often costs lock manager access, so use it for diagnosis and not in a tight monitoring loop [7]S. A query over pg_stat_activity that selects sessions with wait_event_type = 'Lock' and prints pg_blocking_pids(pid) next to them should show the ALTER blocked by the idle session and each reader blocked by the ALTERO. We did not capture those outputs in the experiment suite, so we cannot show you a measured listing here. Run it yourself against a deliberate block.
2.9 What this chapter did not measure§
The stalled workload in E1 was plain reads. We did not run it with writers, with a table of production size, with more than one DDL waiting, or with a replica. We did not test other lock modes against each other. The nine waiting sessions were sampled once. All numbers are from one laptop with tmpfs storage and a busy host, so they show the shape, and the 5 s comes from the 6 s hold we chose. In production the wait is however long the oldest conflicting transaction has leftO. Chapter 3 takes the ALTER out of the queue after a bounded wait and measures what that buys.
Chapter 3
lock_timeout and retry as a protocol§
The question: What lock_timeout, and what retry loop, makes DDL safe to attempt on a busy table?
In the model of chapter 2: a queued lock request blocks everyone behind it, so the only way to stop paying for the queue is to leave it.
Chapter 2 ended on a bad trade. A one line ALTER that needs milliseconds of work waits for an unrelated transaction, and every later reader and writer waits behind it. You cannot make the ALTER cheaper, because its cost is not the problem. What you can change is how long it is willing to wait. That is the whole idea of this chapter: attempt the change, abandon the attempt quickly, and try again later. The protocol is a short timeout on each attempt, a pause between attempts, and a bound on the total. The bound is the part most often forgotten.
3.1 What lock_timeout does, and what it does not§
The PostgreSQL documentation says lock_timeout aborts a statement that waits longer than the given time to acquire a lock, that it applies to each lock acquisition attempt, and that it counts only while the session is waitingS [10]. Work done after the lock is held is not limited by it. A rewrite that takes ten minutes under the lock is not stopped by a 200 ms timeout, which is a chapter 4 problem and has a different tool, statement_timeout.
The same page advises against setting lock_timeout in postgresql.conf, and calls it pointless to set it at or above statement_timeoutS [10]. The first rule has a practical reading: set it for the migration session, not for the server, because a global value would also abort ordinary application statements that wait on a row lock. The second rule is arithmetic, and the next section applies it.
Postgres will not retry for you. A statement that fails on a lock timeout returns an error, and nothing in the server runs it againS [9]. The migration tool has to do it. It sounds trivial, and it is where many one-off migration scripts fail: they set a timeout, the first attempt loses to a long transaction, and the deploy stops with half a release applied.
3.2 The loop§

The minimum viable form, as a shell sketch, is this. The harness for this paper used the same shape with a fixed 0.3 s pause and one psql call per attemptM [1].
for attempt in $(seq 1 "$MAX_ATTEMPTS"); do
  err=$(psql -v ON_ERROR_STOP=1 \
       -c "SET lock_timeout = '200ms';" \
       -c "ALTER TABLE acct ADD COLUMN note text;" 2>&1 >/dev/null) \
    && exit 0                   # applied
  echo "$err" | grep -q "lock timeout" || { echo "$err" >&2; exit 2; }
  sleep "$(backoff "$attempt")"
done
echo "gave up" >&2
exit 1                          # caller must see this
Three details matter more than the syntax. The timeout is set in the same session that runs the DDL, and each attempt opens a clean one, so a failed attempt leaves no transaction state behind. The loop must tell a lock timeout apart from any other error. A syntax error or a missing column retried fifty times is only a slow failure, so the harness retried only on the lock timeout message and stopped on anything elseM. And the pause: between attempts the lock queue drains and the blocked readers run. A loop with no pause re-enters the queue immediately and keeps the table in a permanent soft stall. Our loop used a fixed pause, and we did not test growing or jittered pauses, so those are the shape of the pattern, not a measured resultO.
Published implementations differ on the numbers. GitLab’s migration guide describes its helper as many short attempts, up to 50 tries, each with its own lock_timeout and a sleep between themS [4]. The guide is a living document and we did not capture the per attempt timeout or sleep values, so we do not quote them. The point is the structure: many cheap attempts instead of one long wait.
3.3 What we measured§
The setup is the one from chapter 2, on PostgreSQL 16.15 and 17.11. A table of 100 thousand rows took reads at a fixed 500 per second. One session held a transaction open for 6 s, and one second in, a migration ran ALTER TABLE... ADD COLUMN through the loop above, with a 0.3 s pause between attemptsM [1]. Without a timeout, the readers stalled for about 5.0 s, nearly the whole remaining hold of the long transaction (chapter 2). We ran the 50, 200, 1000 and 3000 ms arms, six repetitions each in total (3 in each of two full runs). The data directory was on tmpfs, the host was a laptop under a load average of 4 to 27 on 14 cores, and the times below are lab shapes, not expected production times.
| lock_timeout | Longest read stall | Attempts | Migration applied |
|---|---|---|---|
| none | 5.0 s | 1 | after about 5 s, the stall is the wait |
| 50 ms | about 0.06 s | see note | median about 5.2 s |
| 200 ms | about 0.21 s | about 10 | median about 5.0 to 5.3 s |
| 1000 ms | about 1.01 s | about 4 | median about 5.0 to 5.3 s |
| 3000 ms | about 3.0 s | about 2 | median about 5.0 s |
Three things follow from the table. The stall tracks the timeoutM: about 0.21 s at 200 ms, about 1.01 s at 1000 ms and about 3.0 s at 3000 ms, against about 5.0 s with no timeout, with the same result on both versions in both runs. The migration landed in every arm after the reader finished in all but one repetition (medians 5.0 to 5.3 s, range 0.41 to 9.0 s). In the 0.41 s repetition the ALTER ran before the reader had taken its lock, a start race in the harnessM. A timeout does not make the DDL faster. It converts one long stall into several short ones.
Second, the stall is not gone. Each failed attempt stalled readers for about the timeout: about 0.06 s at 50 ms, 0.21 s at 200 ms, 1.01 s at 1000 ms and 3.00 s at 3000 msM. The 50 ms stall is the least certain figure in the table. The host load was high in the first run and the p99 for that arm was out of tolerance on 16.15, so read it as direction only: the stall was small, and we make no claim about its tail. If you count the stalls instead of taking the longest one, ten attempts of about 0.2 s add up to roughly 2 s of blocked reads inside a 5 s windowD. We did not measure that sum, only the longest single stall, so treat it as arithmetic.
Third, the trade on attempts. With a 6 s reader the migration took about 2 attempts at 3000 ms, about 4 at 1000 ms and about 10 at 200 ms (medians of both versions)M. The spread across repetitions was real: at 1000 ms on 17.11 the count ranged from 2 to 5, and at 200 ms from 7 to 10. These counts follow from the loop. With the reader holding for about 5 s after the first attempt, each attempt costs the timeout plus the 0.3 s pause, and 5 s divided by 0.5 s is 10, divided by 1.3 s is about 4, divided by 3.3 s is about 2D. They depend on the reader’s hold time, the timeout and the pause, so they are the counts of this lab, not a prediction for your table.
3.3.1 Reading the three numbers against the advice§
Published advice does not agree. Xata suggests 1 s and calls under 2 s common [9], Citus suggests 2 s [8]S, and the strong_migrations README gives 10 s as its exampleS [11]. We ran neither 2 s nor 10 s, so we cannot rank them, and we will not name a best value: nothing in this lab transfers to a table we did not testO. What the sweep does show is the shape of the choice. A longer timeout means fewer attempts and a longer worst stall per attempt. A shorter one means a short stall and more attempts, each of which is another chance to hit the queue at a bad moment. The right number is bounded above by the stall your users will tolerate. It is bounded below by this: the timeout plus the pause, times the attempts you allow, must exceed the longest transaction you expect on that tableO.
3.4 Sizing the budget§
The loop has two bounds. Write them down before the migration runs. One attempt costs the timeout plus the pause, so a budget of N attempts holds the migration for at most about N times (timeout + pause), and the arithmetic is the same one that explained the attempt counts aboveD. With a 200 ms timeout, a 0.3 s pause and 10 attempts that is about 5 s. With 3000 ms it is about 33 s. Pick the budget first, as the longest you will let a deploy wait on a lock, then pick a timeout the users can absorb, then read off the attempts. The documentation’s warning about statement_timeout is the reason to keep the order straight: a timeout at or above it can never fire firstS [10].
3.5 When the reader outlasts the loop§
A bounded loop must be able to fail. We ran an arm where the migration gave up after about 3 s of retrying, before the 6 s reader finished, with a 200 ms timeout. The column was never added, the loop stopped after about 3.3 s and 3 to 6 attempts (median 5.5 or 6), and the longest read stall stayed at about 0.21 s on both versions in the first runM. In a rerun, one of six PostgreSQL 16 repetitions applied the migration after about 5 s instead of giving up, on a host that was not quiet, and we did not isolate whyM. Treat the give-up bound as something to test on your own runner. Readers stalled about 0.21 s, and the migration reported that it had not run.
A migration that cannot give up will eventually become the incident it was trying to avoid.
That is the good failure, and the design goal. The cost moves to the caller. The runner must treat “gave up” as a non-zero exit, stop the deploy, and tell a human, because the schema is still the old one and the new app version cannot run against it. Retrying from a scheduler, an hour later, is fine. Letting a deploy continue as if the step had passed is not.
3.5.1 Why the pause matters as much as the timeout§
The pause sets how much of each cycle the table is open. With a 200 ms timeout and a 0.3 s pause, a cycle is about 0.5 s, and the queue is in place for the first 0.2 s of it, so reads flow freely for about 60 percent of the cycleD. At 3000 ms with the same pause the table is open for under 10 percent of each cycle, and the loop begins to look like the single long wait it replacedD. This is arithmetic from the loop parameters. We did not measure throughput inside the pauses, so it is a reason to keep the timeout short, not a result.
3.6 What the caller does with each outcome§
The loop has three exits, and the runner around it should treat them differently. This is our own reading of the protocol, not a measured resultO.
| Exit | What it means | What the runner does |
|---|---|---|
| Applied | The lock was free for the length of one statement | Continue to the next step. Record the attempt count, because a rising count is an early sign that long transactions are becoming common on that table. |
| Gave up | A blocker outlasted the whole budget | Stop the deploy and leave the old schema in place. Report the blocker (chapter 2 showed how to find it). Retry later, not in a tighter loop. |
| Other error | Not a lock timeout: bad SQL, missing object, permissions | Fail at once. Retrying hides a defect behind a delay. |
The first row is quieter than it looks. A migration that succeeds on the ninth attempt and one that succeeds on the first are both green in a deploy log. Only the attempt count shows that on that day something held the table for most of four seconds at a 200 ms timeout and a 0.3 s pause. We have not measured that signal over time, so it is a suggestion, not a findingO.
3.7 Adding it to a runner§
The change is small. Set lock_timeout in the migration’s own session, not in the server configuration, as the documentation advises [10]S. Wrap each lock-taking statement in the loop, and nothing else: a statement that takes no strong lock needs no retry. Choose the budget before the timeout, as above. Make “gave up” a distinct, non-zero exit. Then test the failure path on purpose, the way the give up arm did: hold a transaction open on a staging copy of the table for longer than the budget, run the migration, and check three things. The column is absent, the runner exited non-zero, and readers on the table barely noticed. If you only ever test the happy path, the first time the give up branch runs will be in production.
3.8 What this chapter did not measure§
We ran four timeouts (50, 200, 1000 and 3000 ms), not 100 ms, 2 s or 10 s. The pause was a fixed 0.3 s, so backoff and jitter are not measured. There was one reader, one table of 100 thousand rows, one DDL statement and no replicas. Every number comes from a data directory on tmpfs under a noisy host, and the 50 ms arm carries the limits stated above. None of it says how long a lock wait lasts on your production table. It says what the protocol does when a lock wait is five seconds long.
Chapter 4
Metadata only, scan, or rewrite§
The question: Which common changes are instant, which scan, and which rewrite the table?
In the model of chapter 1: the time to run is the second clock. Once the lock is held, what is left depends on which of three cost classes the statement falls in.
Chapters 2 and 3 were about the wait for the lock. This chapter is about what happens after you get it. The lock mode names who is blocked. The cost class decides for how long. Two statements can both take ACCESS EXCLUSIVE on the same table and differ by about a millisecond against about a second in how long they hold it in this lab. The difference between them is often one default value.
4.1 Three classes§
Metadata only. The statement edits the system catalogs and leaves the table’s data file alone. Its cost does not depend on the number of rows. Scan. The statement reads every row to check something, and writes nothing new. Its cost grows with the table, and the lock it takes while scanning decides who waits. Rewrite. The statement builds a new copy of the table and its indexes, then swaps it in. It costs time proportional to the table, needs extra disk, and under ACCESS EXCLUSIVE it blocks everything for the whole copy.
The PostgreSQL ALTER TABLE page states that most forms acquire ACCESS EXCLUSIVE unless noted, and that with several subcommands in one statement the strictest lock applies [5]S. So the lock level alone tells you little. For ADD COLUMN the question that matters is the class.

4.2 What the documentation says§
Before PostgreSQL 11, adding a column with any default rewrote the table. The PostgreSQL 11 release notes say ADD COLUMN with a non-null default no longer does so when the default is a constant [12]S, and the ALTER TABLE page says a non-volatile default is stored in metadata [5]S. The same page lists what still rewrites the table and its indexes: a volatile default, a stored generated column, an identity column, and a domain with constraints [5]S. It also says a column type change rewrites the table unless the old and new types are binary coercible, and that it can need up to double the disk space [5]S.
A default is volatile if it can return a different value on each call. We measured one volatile default, clock_timestamp(). And the disk warning is a capacity problem on top of a lock problem: a rewrite that holds the lock for the copy also needs room for the copy.
| Change | Class | Table lock | What the documentation adds |
|---|---|---|---|
ADD COLUMN, constant defaultS | Metadata only | ACCESS EXCLUSIVE, briefly | Default stored in the catalog since PostgreSQL 11 |
ADD COLUMN, volatile defaultS | Rewrite | ACCESS EXCLUSIVE | Table and indexes rewritten |
ADD COLUMN, stored generated or identityS | Rewrite | ACCESS EXCLUSIVE | Table and indexes rewritten |
ADD COLUMN with a constrained domainS | Rewrite | ACCESS EXCLUSIVE | Listed with the rewriting forms |
ALTER COLUMN TYPES | Rewrite, unless binary coercible | ACCESS EXCLUSIVE | Can need up to double the disk space |
SET NOT NULLS | Scan | ACCESS EXCLUSIVE | Scan skipped if a valid CHECK already proves it |
ADD CONSTRAINT... CHECKS | Scan | ACCESS EXCLUSIVE | NOT VALID skips the scan and commits immediately |
VALIDATE CONSTRAINTS | Scan | SHARE UPDATE EXCLUSIVE | The scan runs under a lock that does not block writes |
ADD FOREIGN KEYS | Scan | SHARE ROW EXCLUSIVE on both tables | Chapter 5 covers the two step form |
4.3 What we measured§
We ran one experiment for this chapter, on one table size. The table had 3 million rows and took 298 MB. Three variants of ADD COLUMN ran: no default, a constant default, and a volatile default. While each ran, a reader loop kept querying the table at a fixed arrival rate of about 500 transactions per second, and we recorded the stall, the longest gap between two consecutive completed transactions [1]M. Each variant ran 4 times per version, 2 in each of two complete runs. All numbers are lab shape: the data directory was on tmpfs, the host was a laptop whose one minute load average ranged from about 4 to 13 during this experiment, and none of it is a production duration.
| Variant | Time, 16.15 | Time, 17.11 | Rewrite | Size after |
|---|---|---|---|---|
| No default | 0.35 ms | 0.32 ms | no | 298 MB |
| Constant default | 0.58 ms | 0.64 ms | no | 298 MB |
| Volatile default | 1036 ms | 963 ms | yes | 321 MB |
ADD COLUMN time on a 3 million row table, in this lab. Both runs agreed on every class. Millisecond figures are shape, not durations to expect elsewhere.The no default and constant default variants were metadata only. The statement took well under a millisecond, the table size did not change, and readers stalled for 0.02 s, the same as with no DDL at all M. The volatile default rewrote the table: it took about a second, the table grew from 298 MB to 321 MB, and concurrent reads stalled for 1.03 s on 16.15 and 0.96 s on 17.11, matching the statement time within the 0.94 to 1.12 s spread across repetitions M. While the table file was being rebuilt, a reader could not get in, and the reader waited for about as long as the copy took.
We draw two conclusions and refuse a third. The first is the class: the same one line of SQL moved from a catalog edit to a table copy because of one word in the default. The second is that the stall tracks the rewrite, so the rewrite is the thing to avoid on a table that serves traffic. The third, which we will not draw, is a rule for how long a rewrite takes on your table. We ran one size. Three million rows on RAM-backed storage took about a second here, and we make no claim that ten times the rows takes ten times as long, or about what the same change costs on disk, with indexes, or under concurrent writes. Measure on a copy of your own data, and read the first column of the decision table to know which class to expect.
We did not run an identity column, a stored generated column, a constrained domain or a type change, and we did not run a second table size. Those rows of the decision table are the documentation’s statements only.
4.4 The middle class, measured once§
A scan holds its lock for the time it takes to read the table, and it writes nothing new. The documentation says SET NOT NULL scans the table unless a valid CHECK constraint already proves the column has no nulls, in which case the scan is skipped [5]S. Chapter 5 uses this in full. Here it is the example of the scan class. In the same lab on the same 3 million row size, SET NOT NULL directly took 64 ms on 16.15 and 101 ms on 17.11 under ACCESS EXCLUSIVE. After a validated CHECK on the column, the SET NOT NULL step took about 0.2 ms (0.216 ms and 0.235 ms) M. The CHECK validation did the reading earlier, under a lock that does not block writers. We measured this at one size, so the figures say that a scan costs between the metadata class and the rewrite class on this table, and say nothing about how long a scan takes on yours.
The practical point is that the scan class is the one you can move. A metadata change cannot get cheaper and a rewrite cannot be avoided once you issue it, but a scan can often be done earlier under a weaker lock, so the strong lock is held only for the cheap final step. A rewrite can be avoided only by not asking for it, which is the subject of chapter 6.
4.5 Why a rewrite costs more than its statement time§
The one second in the table above is the visible part. Three further costs sit behind it, and the lab measured none of them except the size growth.
Disk. The documentation says a type change can need up to double the disk space [5]S. The volatile default grew this table from 298 MB to 321 MB M. The documentation describes the rewrite as building a new copy, so both copies exist until the swap [5]S. A rewrite on a nearly full volume fails late, after the lock has been held for a long time.
Indexes. The documentation says the rewriting forms rebuild the table and its indexes [5]S. We did not vary the number of indexes, so the lab cannot say how much they add.
The queue. Chapter 2 showed that waiting for a lock stalls readers for as long as the lock takes to arrive. A rewrite adds its own stall after the lock arrives. A rewrite that queues behind a long transaction therefore stalls readers twice: once while it waits, and again while it copies. The lock_timeout of chapter 3 bounds the first stall and does nothing about the second, because it applies only while waiting for the lock [10]S. We did not run this combination, so it is an inference from the two measurements, not a result.
4.6 A worked example§
Suppose you need a status column on a large table, filled with 'new' for old rows and never null. The one line version, ADD COLUMN status text NOT NULL DEFAULT 'new', is a constant default, so on PostgreSQL 11 or later it is metadata only and the column is not rewritten [12]S. That is the case where the obvious statement is also the cheap one. Change the default to clock_timestamp(), the one volatile default we ran, and the same line becomes a rewrite under ACCESS EXCLUSIVEM. Change the type of an existing column and the answer depends on whether the types are binary coercible, which you should look up for the pair you have, because the documentation does not make it a guess [5]S.
Several of the scan class changes have a cheaper split form. Add the column as nullable, backfill in batches, then add the constraint through the CHECK route above. Chapter 5 gives the steps and the lock at each one, and chapter 6 does the same for changes that cannot be split this way.
4.7 Telling the classes apart before you run§
Reading the statement against the decision table is the first check. A second check is cheap on a copy of the database: note the table’s file node before and after with pg_relation_filenode, and compare the table size. A rewrite creates a new file, a metadata change does notO. In our runs the size column showed it, 298 MB against 321 MB, and the statement time agreed.
Linters automate the first check. The strong_migrations documentation lists checks for a volatile default and for column type changes [11]S. Squawk has rules named adding-not-nullable-field, constraint-missing-not-valid, require-concurrent-index-creation, changing-column-type and require-lock-timeout [13]S. We read only the rule names, not the rule descriptions, so we say nothing about what each rule catches. Chapter 9 returns to what such tools cannot see.
4.7.1 Prove it§
Take your last ten migrations. For each statement write down one word: metadata, scan or rewrite. For every scan or rewrite, write the table’s size and the lock it takes. Anything marked rewrite on a table you cannot afford to freeze needs a different plan, which chapters 5 and 6 give.
Chapter 5
Indexes, constraints and backfills§
The question: How do you add an index or a constraint, or fill a column, without blocking writers?
In the model of chapter 2: swap one strong lock held for a long time for a cheap lock now and a weak lock held for a long time.
Chapter 4 sorted changes into metadata only and rewrite. Indexes and constraints are the third kind: no rewrite, but a full scan of the table. The scan is the cost, and the question is which lock you hold while it runs. Every fix in this chapter has the same shape. Do the cheap step under the strong lock. Do the long scan under a lock that lets writers through.
5.1 Indexes: plain against CONCURRENTLY§
The PostgreSQL manual says a plain CREATE INDEX blocks writes to the table until it finishes. CREATE INDEX CONCURRENTLY instead takes SHARE UPDATE EXCLUSIVE, scans the table twice, and waits for transactions older than its scans. If it fails it leaves an INVALID index behind. It cannot run inside a transaction block, and only one concurrent build runs per table [6]S. The same page says it is not supported on partitioned tables [6]S.

5.1.1 What we measured (E4)§
We built an index on a 2 million row table while pgbench ran an update workload at a fixed 500 transactions per second, on PostgreSQL 16.15 and 17.11 [1]M. The data directory sat on tmpfs, the table was scaled down, and the host was not quiet (load average 4 to 27 across the runs), so read every time below as the shape of the result and never as a production duration.
A plain CREATE INDEX stalled writes for about 1.15 s on 16.15 and 1.20 s on 17.11, and the p99 latency of a request rose to roughly 0.9 s. CREATE INDEX CONCURRENTLY stalled them for about 0.03 s (0.025 s and 0.038 s), at the noise floor of the no-DDL baseline, with no failed requests M. Both runs agree. One 17.11 repetition of the concurrent build reached 0.139 s, so do not read “zero”.
| E4 arm, 2 million rows | Write stall 16.15 | Write stall 17.11 | Build time 16.15 | Build time 17.11 |
|---|---|---|---|---|
| Baseline, no DDL | 0.02 s | 0.02 s | none | none |
Plain CREATE INDEX | 1.15 s | 1.20 s | 1.15 s | 1.20 s |
CREATE INDEX CONCURRENTLY | 0.03 s | 0.04 s | 1.39 s | 1.40 s |
| Concurrent, 15 s old transaction open | 0.02 s | 0.03 s | 14.0 s | 14.0 s |
The concurrent build took longer than the plain one in this lab, 1.39 s against 1.15 s on 16.15 and 1.40 s against 1.20 s on 17.11 M. We print the direction only. The 17.11 concurrent time moved too much between runs to quote a ratio, and the lab ran each arm only four times per version. You pay in build time and in a slower, wait-prone statement, and you get writers that keep running.
5.1.2 The old transaction§
The second scan has to wait until every transaction that could see the table’s older snapshot has ended. We held a 15 s transaction open and started the concurrent build behind it. The build finished in about 14.0 s on both versions, while writers were stalled for only about 0.02 s M. The build time was the hold time of the other session, set by our script, and not a cost of the index M. A forgotten session idle in transaction makes CREATE INDEX CONCURRENTLY wait the same way, and chapter 2 showed the same session stalling a plain ALTER. We did not run the build behind an idle in transaction session, only behind the 15 s active one.
5.1.3 The INVALID leftover§
We forced the failure with a unique concurrent index over duplicate values. That fails in the first scan, so the index was not ready. A failure in a later phase can leave a ready invalid index, which we did not test. In every repetition on both versions it left exactly one INVALID index, with its ready flag false, and the index stayed there until we dropped it M. DROP INDEX CONCURRENTLY removed it in 47 ms on 16.15 and 61 ms on 17.11 M. Drop the leftover, then retry the build. We did not test a retry without the drop.
5.2 Constraints: add it unchecked, then check it§
A constraint added the plain way scans the table while holding a lock that blocks writes. The ALTER TABLE manual describes the two step form: ADD CONSTRAINT... NOT VALID skips the initial scan and commits at once, and a later VALIDATE CONSTRAINT takes only SHARE UPDATE EXCLUSIVE, so it does not block normal writes. ADD FOREIGN KEY takes SHARE ROW EXCLUSIVE on both tables [5]S. We did not record lock snapshots, so the lock modes here are the manual’s statements, not our measurements.
A NOT VALID constraint is not unenforced. In our lab an insert with a missing parent, sent right after ADD FOREIGN KEY... NOT VALID, was rejected, while existing rows stayed unchecked until the validate step M. New writes obey the rule from the first commit. Old rows are checked later.
5.2.1 Foreign keys (E5)§
On a 3 million row child table and a 100 thousand row parent, with inserts at 500 per second, the direct ADD FOREIGN KEY stalled inserts for about 0.33 s on 16.15 and 0.23 s on 17.11. The split form (NOT VALID, then VALIDATE) stalled them for about 0.02 s on both M. The no-DDL control stalled for 0.02 s, the same as the baseline, so 0.02 s is this lab’s noise floor for every stall in this section M.
We do not print DDL times or p99 for the foreign key arms. Several of them differed between the two runs by more than our tolerance, and under load they say more about the laptop than about the statement.
5.2.2 CHECK and SET NOT NULL§
A plain ADD CONSTRAINT... CHECK also scans under a blocking lock. On 3 million rows it took 82 ms on 16.15 and 106 ms on 17.11 and stalled inserts for 0.086 s and 0.108 s, while the NOT VALID then VALIDATE form stalled them for about 0.022 s M. The direction held in both runs. The stall is small and close to the 0.02 s noise floor, so treat it as a direction, not a measure.
SET NOT NULL is the case where the split shrinks the strong-lock step the most. The manual says it skips the scan when a valid CHECK constraint already proves the column is not null [5]S. In the lab, SET NOT NULL on 3 million rows took 64 ms on 16.15 and 101 ms on 17.11 under a blocking lock. After a validated CHECK on the same column, the same statement took 0.216 ms and 0.235 ms M. The strong-lock step shrinks from 64 and 101 ms to about 0.2 ms. The whole via-CHECK path is not cheaper (84 and 63 ms in total), the gain is that the long part runs under the weak lock. The stalls (0.067 and 0.104 s direct, 0.022 and 0.028 s via the CHECK) sit close to the 0.02 s noise floor, so read the direction M. The order is: add the CHECK as NOT VALID, validate it, run SET NOT NULL. The CHECK can then be droppedO.
| E5 arm, 3 million rows | Stall 16.15 | Stall 17.11 | Statement 16.15 | Statement 17.11 |
|---|---|---|---|---|
| No DDL control | 0.02 s | 0.02 s | none | none |
ADD FOREIGN KEY, direct | 0.33 s | 0.23 s | not printed | not printed |
FK, NOT VALID then VALIDATE | 0.02 s | 0.02 s | not printed | not printed |
ADD CHECK, direct | 0.09 s | 0.11 s | 82 ms | 106 ms |
CHECK, NOT VALID then VALIDATE | 0.02 s | 0.02 s | see text | see text |
SET NOT NULL, direct | 0.07 s | 0.10 s | 64 ms | 101 ms |
SET NOT NULL after a validated CHECK | 0.02 s | 0.03 s | 0.22 ms | 0.24 ms |
5.3 Backfills in batches§
We did not run a backfill experiment. What follows is from two sources, and we make no timing claim about it.
Filling a column or rewriting data inside the schema migration holds one long transaction and, in the same transaction, whatever lock the DDL took. strong_migrations and GitLab both describe doing the data work outside the schema migration, in batches [11, 4]S. Each batch is its own short transaction, so row locks and old snapshots are held for a moment, not for the length of the job. GitLab also documents a 15 s statement timeout on GitLab.com and a 20 minute limit for concurrent operations [4]S. Those are their figures for their system.
strong_migrations adds constraints with validation switched off and validates in a separate migration, and notes that a concurrent index must be created outside a DDL transaction [11]S. That is the same shape as the rest of this chapter. In E6 of chapter 6 the batch size was 50000 rows, chosen for the script, and we ran no sweep of batch sizes, so we have no basis to recommend one D. Choose it by watching the lock waits and replication lag of your own system, and state what you chose.
5.4 A migration, split by lock§
This is the derived plan, assembled from the rows above and not itself run as one script D. Each statement is tagged with the lock the source documents for it. Run lock_timeout as in chapter 3 on every step that needs the strong lock.
-- 1. index: outside a transaction, weak lock, waits for old sessions
CREATE INDEX CONCURRENTLY idx_orders_user ON orders (user_id);
-- 2. foreign key: cheap lock now, scan later under the weak lock
ALTER TABLE orders ADD CONSTRAINT fk_user
  FOREIGN KEY (user_id) REFERENCES users (id) NOT VALID;
ALTER TABLE orders VALIDATE CONSTRAINT fk_user;
-- 3. not null: prove it with a CHECK first
ALTER TABLE orders ADD CONSTRAINT c_nn
  CHECK (user_id IS NOT NULL) NOT VALID;
ALTER TABLE orders VALIDATE CONSTRAINT c_nn;
ALTER TABLE orders ALTER COLUMN user_id SET NOT NULL;ADD CONSTRAINT, SET NOT NULL) and a long weak-lock one (VALIDATE). Table and column names are examples.5.5 Prove it on your own tables§
List your last ten migrations. For each, write the class and the lock from the manual: metadata only, scan under a weak lock, scan under a blocking lock, or rewrite. Any statement in the third class is a candidate for the split in this chapter. Then run that statement on a staging copy while a steady write load runs, and write down the stall, as E4 and E5 did. Compare the number against the 0.02 s of an idle control on your own machine, not against ours. Our figures are a laptop on tmpfs and say nothing about your data size, your storage or your concurrency.
Chapter 6
Expand and contract with two app versions§
The question: How does a breaking schema change ship while old and new app code run at once?
During a rolling deploy there is no instant at which every process runs the same code. Old and new application versions share one database for minutes or hours. A schema change that only the new version understands breaks the old one the moment it commits. The lock chapters made the DDL statement itself cheap. This chapter covers the other half: keeping the schema acceptable to both versions at every step.
6.1 The pattern and who wrote it down§
Fowler’s Parallel Change page describes three phases, expand, migrate and contract, and says most database refactorings follow that shape [14]S. Fowler and Sadalage’s Evolutionary Database Design describes small versioned migration scripts, a transition phase that supports old and new access, and a backward compatible schema shipped before the application code [15]S. That article does not use the words expand and contract, so we attribute the term to the Parallel Change page onlyS.
Stripe’s account of moving subscription data uses four steps: dual write, change reads, change writes, remove the old data [16]S. It is the same idea at the scale of a whole object store, and the steps stay the same when the change is one column. Fowler’s blue green page adds the operational reason: it advises separating the schema change from the application upgrade, so that the router switch stays a fast, reversible act [17]S. GitLab’s migration guide splits regular migrations, which run before the application deploy, from post deployment migrations, which run after it and hold the cleanup [4]S.
6.2 The sequence§
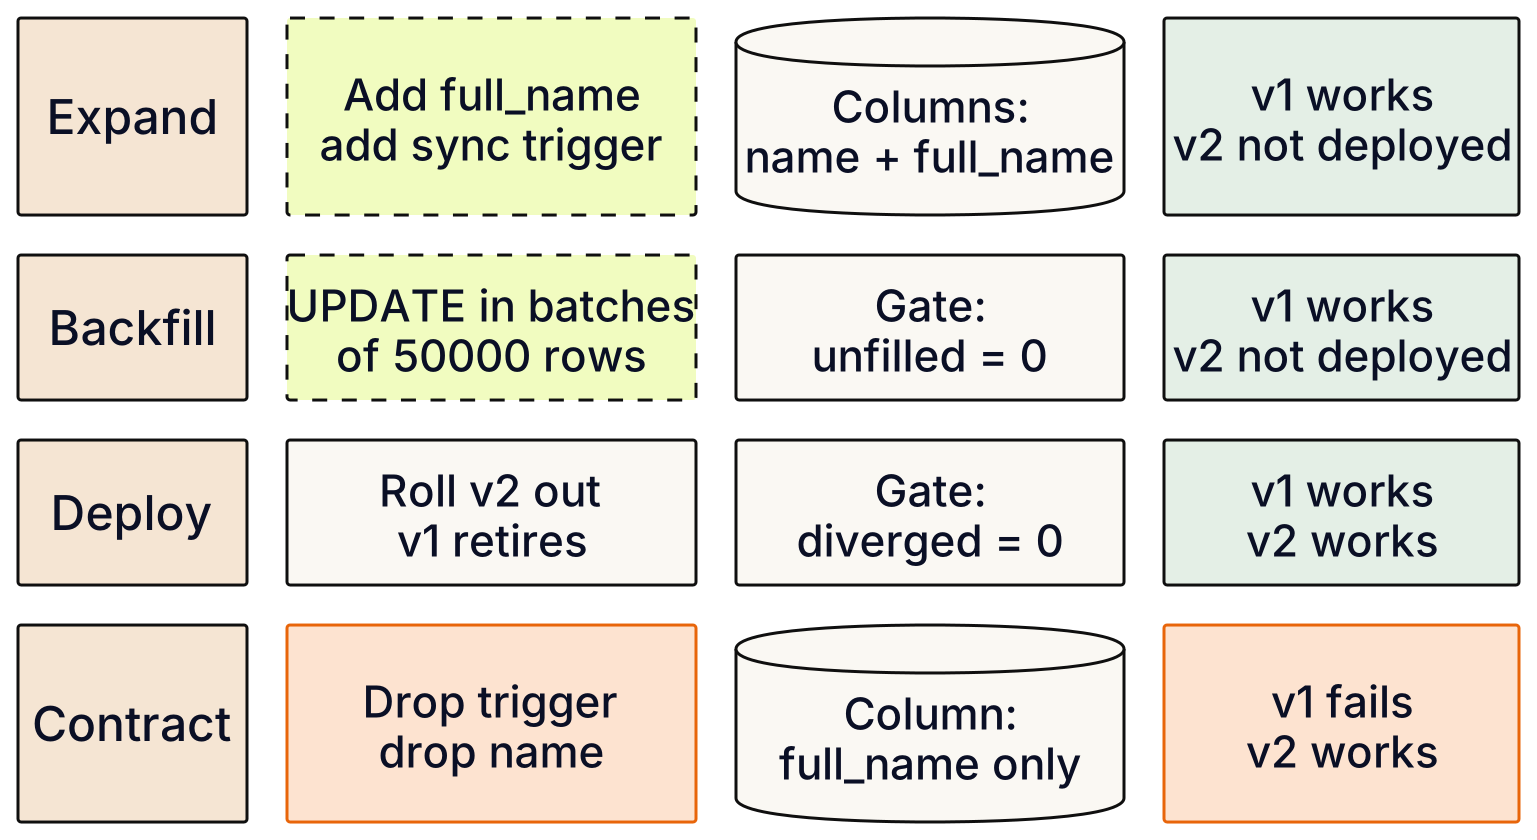
Take a rename. Four steps, each valid for the app versions that can be running when it commitsD:
| Step | Schema change | v1 (old name) | v2 (new name) |
|---|---|---|---|
| Expand | Add the new column and a trigger that copies writes both ways | works | not deployed |
| Backfill | Copy old values into the new column in batches, each batch its own transaction | works | not deployed |
| Deploy | Roll v2 out while v1 retires | works until retired | works |
| Contract | Drop the trigger and the old column, after the last v1 process is gone | fails | works |
Order matters most here. Every step before the last keeps the old version’s queries valid, but the expand step still queues for ACCESS EXCLUSIVE (chapter 2) and needs the chapter 3 protocol. The contract step is the only one that removes something, and it waits until nothing reads the removed thing. So rollback is cheap until the contract step and impossible after it without restoring the column and its dataD. Write the step list before you start, and next to each step write which versions it supports and what undoes it.
6.3 What we ran§
We ran this once, for one change, in a lab. The table had 500 thousand rows on PostgreSQL 16.15 and 17.11, with the data directory on tmpfs. The old version v1 was a pgbench script that read and updated name. The new version v2 was the same script on full_name. Six clients ran each version. Every number in this chapter is lab shape, on one laptop with a host load that averaged 9.5 in run 1 and 14.8 in run 2, peaking at 24.8 (it was not quiet), and none of it is a production time [1]M.
6.3.1 The naive arm§
The control renamed the column in one statement while v1 was running. All 6 v1 clients failed, on both PostgreSQL versions and in both runs [1]M. The limit matters. pgbench stops a client at its first error, so this is 6 clients aborted at their first error. It is not an error rate, and we do not report requests lost per second, because the clients stopped. For the same reason we make no claim about relative cost.
6.3.2 The safe arm§
The safe arm followed table 6.1. We added the column and a sync trigger, backfilled in batches of 50000 rows, started the v2 clients while v1 was still running, retired v1, and then dropped the trigger and the old column. The DDL steps went through a retrying runner, which all succeeded. Expand, backfill and the overlap of v1 and v2 clients completed with 0 failed requests and 0 aborted clients, with about 23000 successful transactions per repetition, on both versions and in both runs [1]M. The contract is not covered by that count. By the script’s timing v2 ran 20 s from the end of the backfill, v1 ran 26 s, and the drop waits for v1. With the usual backfill of about 2 s, v2 had stopped before the contract ran, so its lock was not measured under load. Only a slow backfill (the 9.7 s and 34.5 s repetitions) could have met live v2 clients, and the records do not say. After the backfill 0 rows were unfilled and 0 rows had diverged columns before the contract step, and 0 rows had a null new column after it, in all 6 repetitions on both versions [1]M.
The worst one second stall had a median of 0.03 s on 16.15 and 0.02 s on 17.11. The worst single repetition was 0.24 s on 16.15 and 1.82 s on 17.11, and we cannot say what caused the 1.82 s one: run 2 had a mean host load of 14.8 and a peak of 24.8, but we did not tie the stall to the load [1]M. Eleven of 12 repetitions stayed under the 1 s bound of chapter 1. We print no latency percentiles for this arm: three run to run comparisons fell outside tolerance. The expand and batched backfill step took a median of about 2 s (2.1 s on 16.15, 1.8 s on 17.11), with single repetitions at 9.7 s and 34.5 s [1]M. We did not vary the batch size.
6.4 The two moving parts§
6.4.1 The sync trigger§
While both columns exist something must keep them equal, or a v1 write lands in name and a v2 read of full_name returns a stale value. In the lab a row trigger did this in both directions: on insert it filled whichever column was null, and on update it copied whichever column changed into the otherM. That is the dual write step of Stripe’s four, done inside the database so that neither app version has to know about it [16]S. Every write now runs the trigger, and we did not measure that overhead.
6.4.2 The backfill§
The trigger covers rows written after it exists. Rows nobody touches keep a null in the new column until you copy them. The lab copied 500 thousand rows in 10 statements of 50000, each its own transaction, which kept each lock shortM. GitLab’s guide also describes doing backfills in batches outside the schema migration [4]S. We ran one batch size, so we cannot say which is better for your table.
Two checks gate the next stepD. Before you deploy v2, count rows where the new column is still null. Before you contract, count rows where the two columns differ. The lab ran both counts and both were 0 in every repetition [1]M. A nonzero count means stop, because contracting would destroy the only copy of a value.
6.5 Knowing when contract is safe§
The contract step is safe when no process that reads the old column can run againD. That is a claim about your deploy system, and the database will not tell you. In the lab it was easy, because the v1 clients were a pgbench process that we stopped. In your system the list of readers is longer: web workers that a rolling deploy has not yet replaced, background job consumers that took a job before the deploy, scheduled tasks, analytics exports, and any replica or reporting query that names the column. A job enqueued by v1 can run on v2 hours later.
Fowler’s blue green page gives the reason to keep the contract in a separate release: a router switch is fast to undo, and a dropped column is not [17]S. GitLab encodes the same separation in tooling by running cleanup as a post deployment migration [4]S. A practical rule from thatD: ship the contract step at least one full deploy after the last release that reads the old column, and keep a copy of the old column’s data until you have watched the app run without it.
| Arm | Failed requests | Clients aborted | What it means |
|---|---|---|---|
| One step rename, v1 running | 6 clients ended at first error | 6 of 6 | Every v1 client stopped. Not an error rate. |
| Expand, backfill, deploy, contract | 0 | 0 | About 23000 transactions per repetition, no failures before the contract, which mostly ran after the clients stopped. |
6.6 What this does not show§
Chapter 7
Draining on a rolling deploy§
The question: What does the app do between being taken out of rotation and exiting?
A rolling deploy replaces replicas one at a time, so every deploy is a sequence of planned shutdowns. Whether a shutdown is invisible depends on the order of three events: the router stops sending new requests to the replica, the process receives its stop signal, and a kill timer expires. When the order is wrong, the requests in flight on that replica fail, and no migration step in chapters 1 to 6 can prevent it. This chapter gives the documented order for three platforms and one measured result. The measurement covers one setup only: Docker, nginx 1.27.2 and a small Python app. Everything about Kubernetes and load balancers below comes from their documentation and we did not run it.
7.1 Three clocks and the shutdown§
Docker’s stop command sends SIGTERM and, after a grace period that defaults to 10 seconds on Linux, SIGKILL. The period is set with --timeout and the signal with --signal [19]S. So a process that ignores SIGTERM is not stopped by it, it is killed 10 seconds later, with whatever it was doing.
Kubernetes has the same idea with more parts. The Pod Lifecycle page gives a 30 second default grace period. A preStop hook runs first, then SIGTERM is sent, and SIGKILL follows at expiry, with a single 2 second extension if the hook is still running [20]S. The same page says removal of the pod from Service endpoints is handled in parallel with the start of graceful shutdown, not after it [20]S. That is the race. The router learns about the shutdown by a different path than the process does, and the documented model, as we read it, does not make the router’s path finish firstD. We did not measure how long that propagation takes, so we cannot give you a number for the gapO.
The EndpointSlices page adds the vocabulary. Endpoints carry serving, terminating and ready conditions (stable since v1.26). Proxies ignore terminating endpoints, but may send traffic to endpoints that are both serving and terminating if all endpoints of a Service are terminating [21]S. The rolling update tutorial says pods are replaced incrementally, new pods start before old ones are removed, and a rollout can be undone [22]S. We print no default for the rolling update surge and unavailability settings: the pages we read disagreed and we did not resolve it, so look up your cluster version’s valueO.
An AWS Application Load Balancer has its own clock. Its target group attribute documentation gives a 300 second default deregistration delay. A deregistering target enters a draining state. The delay completes at once when there are no in flight requests or connections. A target that closes a connection early produces a 500 level error for the client [23]S. Documentation only, not measured.
| Docker | Kubernetes | AWS ALB | |
|---|---|---|---|
| Grace clock | 10 s default, then SIGKILL | 30 s default, then SIGKILL | 300 s deregistration delay |
| Router told | Docs say nothing | In parallel with shutdown start | Target enters draining state |
| Ends early | Process exitsD | Process exitsD | No in flight requests |
7.2 What we measured§
Experiment E7 uses two replicas of a small Python HTTP app behind nginx 1.27.2 in Docker. A client sends about 80 requests per second, each request taking 300 ms, and counts every request individually, so the failure counts below are real counts and not the first-error-per-client number that the pgbench chapters report. Each arm sends 1920 requests while we stop one of the two replicas, and each arm ran in 6 repetitions with identical results [1]M. The test app handled SIGTERM by finishing in flight requests and exiting. The drain arm removed the replica by an nginx reload, waited a fixed 1 s (more than three request durations, a sleep and not a check that in flight requests had finished), then sent SIGTERM. Upstream marking used max_fails=1 and fail_timeout=30s. Three ways of stopping the replica:
- kill: the replica is killed with SIGKILL while still in the proxy’s rotation.
- stop without deregister: the replica gets SIGTERM and exits, still in rotation.
- deregister, wait, stop: the replica is removed from the proxy first, the in flight requests are allowed to finish, then it is stopped.
| Arm | Failed | of requests | Proxy retry |
|---|---|---|---|
| kill | 12 | 1920 | off |
| stop without deregister | 1 | 1920 | off |
| deregister, wait, stop | 0 | 1920 | off |
| kill | 0 | 1920 | on (GET) |
| stop without deregister | 0 | 1920 | on (GET) |
The kill arm failed 12 requests. All 12 had started before the stop command was recorded (the first 0.31 s before, the last 0.035 s before), so they were in flight on the replica that diedM. That matches the model: the router had no way to know. The one failure in the stop arm sat on the same edge, 0.01 s before the stop in the medianM. Letting the process exit on SIGTERM is cheaper than a kill but still loses a request when the router keeps sending to a replica that is closing. Removing the replica first, waiting, then stopping lost noneM.
7.2.1 Does 12 make sense§
The client sends about 80 requests per second and each takes 300 ms. By Little’s law the number of requests in flight at any moment is the arrival rate times the time in system, so about 24 across both replicasD. If the proxy split them evenly, about 12 sat on each replica. The kill arm failed 12M. We did not log the per replica split, so this is a consistency check on the order of magnitude and not a proof. The reading it suggests: a kill loses roughly the in flight population of one replica, so the loss scales with request rate times request duration. A service with 3 second requests would lose ten times as many at the same rate. We did not run that caseD.
7.3 An ordering for a rolling deploy§
Chapters 2 to 6 assume old and new application versions run against one schema at the same time. A rolling update gives you that window, because pods are replaced incrementally and new ones start before old ones are removed [22]S. So the schema must work for both versions, and each replica removal must be clean. From the documented clocks and the E7 order, we would run each replica replacement like thisD:
- Start the new replica and wait until it answers requests.
- Stop routing new requests to the old replica (deregister, or mark it terminating).
- Wait for its in flight requests to finish, bounded by the grace period.
- Send the stop signal. The process stops accepting, finishes what it holds and exits.
- Only then let the kill timer matter.
The grace period must be longer than your longest request plus the time the router needs to learn about the removal. The second term is the one we could not measure on Kubernetes or a load balancer, so leave a margin you can justify from your own testD. A short grace period with long requests turns every deploy into the kill arm.
7.4 Retry hides the problem§
With nginx proxy_next_upstream set to retry on error and timeout, both the kill arm and the stop arm failed 0 of 1920 requests, in all 6 repetitionsM. The retry was applied to GET requests, which are idempotent. We did not test whether nginx retries a non idempotent request, and we did not test POST. So the result stops there.
From those arms we conclude, by reasoning and not by a separate measurement, that the retry made the failures invisible to the client while the replica was still removed without a drainD. The retry only works for requests that are safe to repeat. A payment or an insert that reached the dying replica and was retried on the other one is the case that retry cannot be trusted with. Treat proxy retry as a second line of defense for reads. It is not a substitute for deregistering first.
7.5 What we did not measure§
The lab had one proxy, two replicas and a Python test app, with idempotent GETs. We did not run Kubernetes, so endpoint propagation lag is unmeasured. We did not run a cloud load balancer, so the deregistration behavior above is what its page says. The test app had no database connection pool, so we have no number for connections held after SIGTERM or for time back to full capacity. The tmpfs, one laptop and loaded host caveats of the earlier chapters apply, and the counts are lab shape and not production error ratesM.
7.6 Try it yourself§
Restart one replica of your own service under a steady request stream and count responses that are not 2xx, first with your normal deploy command and then with an explicit remove, wait and stop. If the first count is not zero, the drain order is a defect you can fix before touching a schema.
Chapter 8
One procedure: migrate, deploy, roll back§
The question: In what order do schema steps and app rollouts go, and what is the undo at each step?
The earlier chapters measured one hazard at a time. This one puts them in order. The order is borrowed: Fowler and Sadalage ship a backward compatible schema change before the application code, the blue green page says to separate the schema change from the application upgrade, and GitLab runs regular migrations before the deploy and post deployment migrations after it [15, 17, 4]S. This chapter adds one rule: rollback is clean only before the contract step, because contract drops the old column and the previous app version can no longer run against the schemaD.
8.1 The step ledger§
A step ledger lists, for each step, the lock the step takes, its cost class, which app versions it supports and how to undo itD. Table 8.1 is the ledger for the common case of a breaking change, a column rename or a split, shipped as expand, deploy, contract. Figure 8.1 shows the same steps as a flow. All times are lab shape on tmpfs with small tables, never production times. The lab ran PostgreSQL 16.15 and 17.11 at about 500 transactions per secondM.
| # | Step | Lock and cost | What the lab or source says | Undo |
|---|---|---|---|---|
| 0 | Pre-flight | Reads only | A transaction left open ahead of your DDL decides the stall, not the DDL. A queued ALTER stalled all readers for 5.0 s behind a 6 s transaction, active or idle in transaction, against 0.37 ms and a 0.02 s stall with no long transaction (E1)M. Check for old transactions first. The pre-flight list at the end of the chapter has the checks. | Nothing to undo. Stop here if a long transaction is open. |
| 1 | Set lock_timeout | Session setting | The setting applies to each lock acquisition attempt and only while waiting. The documentation advises against setting it globally and calls a value at or above statement_timeout pointless [10]S. Sources suggest 1 s, 2 s or 10 s [9, 11]S. In our lab the stall followed the timeout: about 0.21 s at 200 ms, 1.01 s at 1000 ms and 3.0 s at 3000 ms (E2)M. | Reset the setting. |
| 2 | Retry with backoff, bounded | Each attempt waits at most the timeout | PostgreSQL does not retry a lock failure, so the runner must [9]S. GitLab’s helper makes many short attempts, up to 50, each with a sleep [4]S. In our lab a 6 s reader took about 4 attempts at 1000 ms and about 10 at 200 ms (E2, shell loop with a 0.3 s pause)M. When the reader outlasted every attempt the migration stopped with the column absent and readers saw about 0.21 s of stall (E2)M. | Giving up leaves the schema unchanged. |
| 3 | Expand | Brief ACCESS EXCLUSIVE for most ALTER forms [5]S | Add only things both app versions tolerate, including the sync trigger that keeps old and new columns equal. A nullable column took 0.35 ms and a constant default 0.58 ms on 3 million rows with no rewrite, a volatile default took about 1 s and stalled readers for about the same (E3)M. An index goes in with CONCURRENTLY: writers stalled about 0.03 s against about 1.15 s for a plain build (E4)M. | Drop the new column or index. A failed concurrent build leaves an INVALID index, removed by DROP INDEX CONCURRENTLY in 47 ms (E4)M. |
| 4 | Backfill | One short transaction per batch | The step 3 trigger keeps old and new columns equal while you backfill in batches, each its own transaction, outside the schema migration [11, 4]S. Our expand and contract arm used 50000 rows per batch and failed no requests; we did not vary the batch size (E6)M. | Stop the backfill and drop the trigger. The old column was never touched. |
| 5 | Validate | SHARE UPDATE EXCLUSIVE for VALIDATE [5]S | NOT VALID then VALIDATE stalled inserts about 0.02 s against about 0.33 s (16.15) and 0.23 s (17.11) for a direct foreign key (E5)M. We saw one 8 s stall in an earlier round that did not reproduce in 96 later arms and whose cause we did not establish (E5)M. After a validated CHECK, SET NOT NULL took about 0.2 ms against 64 to 101 ms directly (E5)M. | Drop the constraint. |
| 6 | Deploy with drain | No database lock | Take the replica out of the router, let in flight requests finish, then stop it. In a Docker and nginx lab that failed 0 of 1920 requests, against 12 for a kill and 1 for a stop without removal (E7)M. Kubernetes endpoint lag and cloud balancers were not measured. | Redeploy the old version. It still runs, the old column is thereD. |
| 7 | New version only, watch | None | This is the last point where undo is cheap. The overlap run of old and new clients failed none, with about 23000 successful transactions, for one rename and 6 clients per version (E6)M. The contract was not measured under load. Hold here until you trust the new version. | Same as step 6. |
| 8 | Contract | ACCESS EXCLUSIVE, as an ALTER TABLE form [5]S | Run it as a post deployment migration [4]S, with steps 1 and 2 again. It is the point of no returnD. | None. Roll forward. |
The last rows of the ledger repeat an idea from chapter 3: steps 1 and 2 wrap every step that takes a blocking lock, not only the first. The contract step needs its own timeout and its own retry loop.
8.2 Rollback points§
The ledger gives five places to stop. The table below says what each one costs. The claim in the last row is derived from the schema, since we did not run a rollback test after each stepD.
| Stopped after | State and undo |
|---|---|
| Step 0 to 2 | Nothing changed. A migration that gave up leaves the old schema in place (E2)M. |
| Step 3 to 5 | Old column and old app untouched. Undo is dropping the new objects. CheapD. |
| Step 6 | Mixed fleet. Both versions work against the expanded schema, so redeploying the old version is the undoD. |
| Step 7 | Fleet on the new version only, old column still present. Same undo, held for as long as you delay step 8D. |
| Step 8 and later | Old column dropped. The previous version cannot run. Only a fix forward or a restore remainsD. |
A naive one step rename has no such points. In our lab it made all 6 old version clients fail, on both PostgreSQL versions and in both runs. That is 6 clients aborted at their first error, since pgbench stops a client at its first error, not an error rate (E6)M.
8.3 Checklist per migration type§
One line each. Cost classes come from chapters 4 and 5. Types marked source only were not measured.
| Change | Do this |
|---|---|
| Add nullable column | Steps 1 and 2, one statement. Metadata only in the lab (E3)M. Undo: drop the column. |
| Add column with default | A constant default is metadata only since PostgreSQL 11, a volatile default rewrites the table [5]S. Measured: about 1 s of stall for the volatile case on 3 million rows (E3)M. For a volatile default add the column bare and backfill in batchesD. |
| Add index | CONCURRENTLY, outside a transaction block, one per table [6]S. It waits for older transactions: 14.0 s behind a 15 s one, writers stalled about 0.02 s (E4)M. Check for an INVALID index afterwards. |
| Add foreign key or CHECK | NOT VALID first, then VALIDATE in its own step (E5, direction only, see the chapter 5 limit)M. A NOT VALID constraint already rejects new bad rows (E5)M. |
| Set NOT NULL | Add a CHECK NOT VALID, validate it, then SET NOT NULL (E5)M. |
| Rename column | Not in one step while an old version runs. Expand, sync trigger, batched backfill, deploy, contract (E6)M. |
| Change column type | Source only: the table is rewritten unless the types are binary coercible, and can need up to double the disk space [5]S. Treat it as a rename into a new columnD. |
| Drop column | Only at step 8, after no running version reads itD. |
8.4 A rename, step by step§
Take a column rename on a table that serves reads and writes all day. The naive version is one statement. The ledger version is several releases of work, not one, and that is the price. Step 0 finds no old transaction. Steps 1 and 2 set a session timeout and wrap each blocking statement in a bounded loop, so an unlucky wait costs about the timeout and not the length of someone’s report query (E1, E2)M. Step 3 adds the new column bare, a metadata change in the lab (E3)M, plus the sync trigger. Step 4 runs the backfill in batches while old and new clients both write. Step 6 rolls the fleet one replica at a time with a drain. Step 8 drops the old column in a later release, after the new version has run long enough that you would not roll back.
The lab ran the shape of this sequence once, as the E6 expand and contract arm: expand, batched backfill with a sync trigger, an overlap of old and new clients, then contract, with 0 failed requests and about 23000 successful transactions on both versions and in both runs, counted before the contract step. The contract itself mostly ran after both client sets had stopped, so it was not measured under load. It did not run step 0 or step 6. Steps 1 and 2 appear only as the retrying runner around each DDL (3 attempts in total, no retries needed), and the change was one rename on 500 thousand rows (E6)M. That is why this chapter stops at an ordering argument.
8.5 Limits§
The procedure assumes one Postgres primary, so it says nothing about replicas, sharding or multi-primary setups. The drain step was measured only with Docker and nginx 1.27.2, a small test app and idempotent GET requests. A proxy retry is only safe for idempotent requests and was not tested for POST. Kubernetes endpoint propagation, cloud load balancer drains and database pool draining were not measured, so the sourced behaviors in chapter 7 are what you have for thoseS. Both runs ran on a laptop that did not meet the quiet gate, so every stall under about 0.2 s is a direction and not a numberM.
8.6 Pre-flight§
Chapter 9
Tools, and what they cannot see§
The question: What do linters and migration tools catch, and what do they miss?
We did not run any of them. No linter was pointed at the scripts in this paper, and no migration tool was run in the lab, so we have no measured statement about what any tool catches or misses. What follows is what their own pages say they do, plus an argument about what a tool of that kind cannot see. The argument is derived reasoningD, and the experiments only supply the failure modes to hold it against.
9.1 What the tools say they do§
The strong_migrations README lists checks for unsafe operations. It calls a short lock timeout extremely important and uses 10 s as its example, with a 1 hour statement timeout as a second example [11]S. The lab ran no 10 s arm.
Squawk’s rules index lists rules named adding-not-nullable-field, constraint-missing-not-valid, require-concurrent-index-creation, changing-column-type and require-lock-timeout [13]S. We read the names and nothing else, so we will not say what any rule checks or misses. The names line up with chapters 4 and 5. That is a reason to read the rule pages, not a finding.
pgroll is described, in its README, as serving the old and new schema through versioned views and search_path, keeping columns in sync with triggers, and working as a start step followed by a complete step, on Postgres 14 or later [18]S. That is the expand and contract shape of chapter 6 as a tool. We did not run it, the page gives no release version, and we say nothing about its lock timeout behavior.
One vendor post is notable for what it lacks: Xata’s article on zero-downtime schema migrations describes expand and contract as also known as parallel change, and contains no benchmarks or lock timings [24]S. It is a vendor post and we cite it as one.
9.2 What a statement linter cannot see§
A statement linter reads migration text. Its input is the SQL, so it has no view of the traffic on the target or of the transactions open on itD. Compare chapter 2. The ALTER in E1 was a one line ADD COLUMN that ran in 0.3 to 0.4 ms with no long transaction in the way, and it stalled every reader for 5.0 s when a session had been open for a few seconds firstM. The statement was identical in both arms, and nothing in its text distinguishes the two cases.
The same holds for the idle in transaction variant of E1: an ALTER behind a session left idle stalled readers for 5.0 s on both versions, the same as behind an active oneM. The PostgreSQL documentation names idle_in_transaction_session_timeout as a way to stop idle sessions from holding locks [10]S. That is a server setting, so no migration file can supply it. A linter can check that a migration sets the timeout. It cannot make the retry loop exist.
| Failure mode in the lab | Visible in migration text | Needs the live database |
|---|---|---|
| Queued ALTER behind a long reader (E1) | Whether a timeout is set | Whether such a reader exists now |
| Rewrite on a volatile default (E3) | The default expression | Table size, so how long the lock is held |
| Plain index build or constraint (E4, E5) | Missing CONCURRENTLY or NOT VALID | Write rate during the build |
| Rename with two app versions (E6) | A rename statement | Which app versions are running |
| Stopped replica (E7) | Nothing | Router and app behavior |
The table is derived from the experiments and the sources above, not from running a linterD. The first column is what the lab produced, the other two are our reading. The last row matters most: E7 broke requests with no migration involved at allM, so a migration tool has no say in it.
9.3 What these experiments cannot see§
The lab is one laptop with the data directory in RAM, tables of 100 thousand to 3 million rows and a host that was not quiet in either run [1]M. The list below is what that setup leaves out. Appendix A repeats it with the reasons.
- Production table sizes. The volatile default rewrote a 298 MB table in about 1 s in this labM. We did not measure a larger table. The class (rewrite or not) carries over. The seconds do not.
- Replicas and replication lag. No replica was running. Whether a long lock, a rewrite or a backfill changes what a replica serves, and for how long, is not in the data.
- Long transactions in production. E1 and E4 used one held transaction of a known length, started by us. The lab shows what a long transaction does once it exists, and nothing about how often one is open.
- Poolers. No connection pooler sat between the clients and the server. How a pooler queues clients behind a stalled backend was not tested.
- ORMs and migration frameworks. The migrations were plain SQL run through
psql. Whether a framework wraps a statement in a transaction, sets a timeout or retries on its own was not tested. - Managed services. No managed database was used. Limits on settings, extensions or failover behavior there are untested.
- The whole procedure. Chapter 8 is an ordering built from these measured steps. The procedure itself was not run end to end, and no rollback was tested as a sequenceD.
Chapter 10
Conclusion§
This page covers what the evidence does not settle.
10.1 Where the lab stops§
Everything measured here ran on one laptop, with the PostgreSQL data directory on tmpfs, tables of 100 thousand to 3 million rows, and a host that was not quiet in either run [1]M. Every time is a shape, not a production time. The class of a change (metadata only, scan, rewrite) and the direction of an effect (stalled or not) are the findings. The seconds are not.
10.2 What did not run§
No whole procedure was measured end to end. Chapter 8 is an ordering built from the measured stepsD, and the rollback points in it were not tested as a sequence. Replicas, managed services, Kubernetes endpoint propagation, cloud load balancers, database pool draining, a pgroll arm and a linter run were not tested. Appendix A lists each with the reason.
10.3 What we would not trust yet§
Twelve comparisons between the two runs fell outside the stated tolerance, and the text carries their limits where it prints the numberM. The foreign key stall in chapter 5 comes with one more: an 8 s stall seen once in an earlier round did not reproduce in 96 later arms, and we could not explain it.
10.4 The harness is the contribution§
The scripts, raw records and results file are published with the paper at release. The suite ran twice on one machine and has not been rerun by anyone else. We would rather you rerun it on your own table and tell us where it disagrees than take any number here on trust.
10.5 Next§
Three runs would change this paper most. First, the whole procedure of chapter 8, end to end, with a rollback tested at each step. Second, a rerun of the suite on a quiet machine with the data directory on disk and a table in the tens of millions of rows, to see which times survive. Third, a replica, a pooler and a Kubernetes rollout in the same setup, because those are where the lab has nothing to say.
Appendix A
Method and limits§
This appendix says what was measured and what was not, so that you can tell a finding from a gap. Times are medians over repetitions.
A.1 What ran§
| Item | Value |
|---|---|
| Databases | PostgreSQL 16.15 and 17.11 in Docker (alpine images), pgbench 17.11 as the client, no replicas. |
| Server configuration | Not the default configuration. The data directory is on tmpfs (4 GB) with a 512 MB shared memory segment. shared_buffers 256 MB, max_wal_size 4 GB, checkpoint_timeout 30 min, max_connections 100, synchronous_commit on, and log_checkpoints, log_autovacuum_min_duration 0 and log_lock_waits on. The long checkpoint_timeout and the large max_wal_size keep timed checkpoints out of a 10 to 25 s arm. Authentication is trust on an internal Docker network. |
| Proxy | nginx 1.27.2 in front of two replicas of a small Python 3.12.16 HTTP app (E7 only). |
| Host | Docker 29.8.2 on one aarch64 laptop, 14 CPUs, 15.7 GiB. The quiet start gate (one minute load average below 4) was not met in either run (waited 1202 s each time), and the one minute load average of the host was 4 to 27 during the runs. |
| Load | pgbench at a fixed arrival rate of 500 transactions per second (-R 500), so latency includes the wait behind a stall. Clients: 8 (E1, E2), 4 (E3, E5), 6 (E4, E6, per app version). E7 used its own client at 80 requests per second. |
| Tables | 100 thousand rows (E1, E2), 500 thousand (E6), 2 million (E4), 3 million rows in a 298 MB table (E3, E5, with 100 thousand parent rows). |
| Repeats | Two complete runs. Six repetitions per arm (three per run) for E1, E2, E5, E6 and E7, four for E3 and E4. Results are medians [1]M. |
A.1.1 Definitions and steps§
Stall. The longest gap, in seconds, between two consecutive completed transactions in pgbench’s per-transaction log for the arm. A baseline arm with no DDL shows about 0.02 s at this rate. The stall is not a count of seconds under a throughput threshold.
Failed request. In the pgbench experiments, the first error of a client. pgbench stops a client at its first error, so failed_requests equals clients_aborted, and it says how many clients hit an error, not how many requests would have failed over a whole step. Do not turn it into a rate. In E7 the client counts every request one by one (1920 per arm), so those failures are real counts.
Poll and sample steps. A separate psql session polled pg_stat_activity every 0.25 s with \watch while an arm ran, and recorded the lock waiters, the number of active sessions and the load average read inside the server container. The largest gap between its own samples was 0.25 to 0.33 s in E5, so a stall under 0.25 s is not resolved by the sampler (the pgbench log resolves it). The server log was counted for checkpoint, autovacuum and lock-wait lines. Host load was read from uptime every 5 s.
Order of an arm. E1 and E2: warm up, start a 6 s transaction one second later, run the ALTER one second after that, so it waits about 5 s. E2 retries with a 0.3 s pause between attempts. E4: a 15 s old transaction at repeatable read for the wait arm. E6: backfill in batches of 50 thousand rows. E7: stop one replica 8 s into a 24 s load.
A.2 Experiment status§
The ids follow the results file, which differs from the plan we wrote before running. Our own 39 shape checks all passed (their limits are in build-results.py, so they show the data fit the expected shape and are not independent confirmation), and the table says what each experiment could and could not show.
| Id | What | Status | Detail and limits |
|---|---|---|---|
| E1 | ALTER queued behind an open transaction | Run, all within tolerance | 100 thousand rows. Active and idle in transaction holders, an ALTER with no holder as control. One change, one table, one 6 s holder. |
| E2 | lock_timeout with retry | Run, 50 ms arm partly outside tolerance | Timeouts of 50, 200, 1000 and 3000 ms and a 200 ms give up arm. No 100 ms, 2 s or 10 s arm, so the values the sources suggest were not tested. The 50 ms attempts and p99 on 16.15 disagree between runs. |
| E3 | ADD COLUMN default | Run, all within tolerance | Nullable, constant default, volatile default, at one size. No identity, stored generated or type change, and no second table size. |
| E4 | CREATE INDEX | Run, one comparison outside tolerance | Plain, concurrent, concurrent behind an old transaction, a failed concurrent build. The 17.11 concurrent build time disagrees between runs. |
| E5 | Foreign key, CHECK, SET NOT NULL | Run, 6 comparisons outside tolerance | Direct against NOT VALID then VALIDATE, and a NOT VALID enforcement check. Statement times of the split path and the p99 of the foreign key arms disagree between runs. |
| E6 | Column rename under load | Run, failure counts agree, p99 partly not | Naive rename against expand and contract with a hard switch, six clients per app version. No column split, no ratio sweep. |
| E7 | Stop one of two replicas behind nginx | Run, all within tolerance | Kill, stop without removing the upstream, drain then stop, and the first two with a proxy retry. GETs of 300 ms at 80 per second. |
Not run: E8 (the whole procedure, naive path against procedure path, with a rollback test), a pgroll arm, Kubernetes endpoint propagation, cloud load balancers, database pool draining and a linter run. None of them has a number in this paper.
A.3 What was not measured§
- Replicas and replication lag. No replica. Nothing was measured about what a lock, a rewrite or a backfill does on a standby.
- Large tables. The largest table was 3 million rows (298 MB). No production size, no second size to fit a curve to.
- Managed services. No managed database, and no setting limits that come with one.
- Kubernetes. No cluster, so no grace period,
preStophook or endpoint propagation was tested. Chapter 7 describes those from documentation only. - Cloud load balancers. Only nginx in Docker. Deregistration delay was not measured.
- Pool draining. No pooler, and the number of database connections held after SIGTERM was not recorded.
- Retries of non-idempotent requests. The proxy retry arms used GETs. A retried POST was not tested and is not claimed safe.
- Migration tools and linters. None was run. Chapter 9 uses documentation only.
- Other ALTER forms. Identity, stored generated, type change and column split were not run.
A.4 Threats to validity§
The data directory was in RAM, so storage speed is not in any time. The tables are small against production, so read an absolute time as a shape. The host was not quiet: load 4 to 27 on 14 cores, which moves p99 and short stalls more than the stalls of several seconds that carry the findings. One change ran per experiment, so interactions between steps (a rewrite during a backfill, a retry loop during a deploy) are not covered. Every arm ran with one client script, so mixed workloads are not covered either. The harness never checks that the long transaction holds its lock before the ALTER starts, and under load one E2 repetition applied at 0.41 s because the ALTER ran first; the E2 times range from 0.41 to 9.0 s. In E6 the retiring call waits for the v1 clients before the contract is issued, v2 runs 20 s from the end of the backfill and v1 26 s from its start, so with a backfill of about 2 s the contract ran after both client sets had stopped. The statement that the E6 clients had 0 failed requests therefore covers expand, backfill and the overlap, and the contract was not measured under load; only a repetition with a slow backfill (9.7 s or 34.5 s) could have met live v2 clients. The rewrite check in E3 compared the file node of the table before and after. The pgbench client was version 17.11 against both servers, the Python test app opened a new connection per request (no keepalive), each DDL ran through a new docker exec psql, and the table schema, the reader length (6 s) and the 8 fixed clients were not varied.
What generalises. The cost class of a change and the direction of each effect are the claims. The seconds are not.
Twelve of 346 run-to-run comparisons fell outside the stated tolerance (334 were inside). Tolerances: stall 30 percent or 0.3 s, p99 35 percent or 5 ms, DDL time 40 percent or 100 ms, throughput 20 percent or 50, attempts 50 percent or 3, backfill time 50 percent or 2 s. The twelve: E5 split path statement time (total and last statement) on both versions (4), E5 foreign key p99 on both versions (2), E6 p99 for expand and contract on both versions and for the naive rename on 16.15 (3), E2 50 ms attempts and p99 on 16.15 (2), and the E4 17.11 concurrent build time (1). The text carries the limit wherever it prints a number from these rows.
A stall of about 8 s was seen once in a NOT VALID arm of an earlier round at a host load near 38. In the final round, none of 96 E5 arms (8 variants, 2 versions, 6 repetitions, 24 of them with no DDL, 12 of them NOT VALID foreign key arms) reached a 1 s stall at host loads of 5 to 23. The record of the earlier round is not in the results file. We could not explain it and we have not proved it was a load artifact.
An invalid index left by a failed concurrent build did not lower throughput here (502 tps against 498 at baseline, no failed request), while its ready flag stayed false. That does not show invalid indexes cost nothing: the PostgreSQL documentation says such an index can still add write cost [6]S.
A.5 Host load per experiment§
One minute load average of the host computer, not of the Docker VM, read from uptime.
| Run | Experiment | At start | Mean | Max |
|---|---|---|---|---|
| 1 | E1 | 14.53 | 17.44 | 22.93 |
| 1 | E2 | 12.78 | 13.58 | 26.71 |
| 1 | E3 | 12.77 | 10.1 | 13.04 |
| 1 | E4 | 7.43 | 11.93 | 19.48 |
| 1 | E5 | 9.22 | 10.62 | 22.84 |
| 1 | E6 | 10.74 | 9.51 | 12.75 |
| 1 | E7 | 9.36 | 7.57 | 11.1 |
| 2 | E1 | 4.31 | 5.35 | 6.53 |
| 2 | E2 | 5.05 | 5.16 | 6.71 |
| 2 | E3 | 4.87 | 5.46 | 6.16 |
| 2 | E4 | 5.25 | 5.61 | 9.2 |
| 2 | E5 | 4.81 | 6.45 | 16.89 |
| 2 | E6 | 16.98 | 14.76 | 24.77 |
| 2 | E7 | 10.34 | 8.35 | 12.26 |
Appendix B
Checklists§
Each list is a working copy. Items marked as opinion are our own rulesO, and the others point to the measurement behind them.
B.1 Pre-flight for one migration§
| Done | Step |
|---|---|
| Write the statement, the table and its size on the live database. Write the cost class: metadata only, scan or rewrite (E3)M. | |
| Write the lock mode the statement takes and what it blocks. Plain reads are blocked only by ACCESS EXCLUSIVE [3]S. | |
| Look for open transactions on the table, including idle in transaction ones. Either kind stalled readers for the same 5 s in E1M. | |
Set lock_timeout in the migration session, not in the server configuration, and write the retry bound and the pause. A timeout at or above statement_timeout is pointless (E2)M [10]S. | |
| If the statement scans or rewrites, split it: a short lock step and a long step that blocks nobody (E4, E5)M. | |
| For an index, use CONCURRENTLY and check afterwards that the index is valid. A failed build leaves an invalid one to drop (E4)M. | |
| For a rename or drop, list the app versions that will run during the change. Write the four steps and which version each one supports (E6)M. | |
| Write the rollback point: the last step after which the previous app version still worksD. | |
| Name who watches the failed request count while it runs, and the number at which you stopO. |
B.2 Rolling restart§
| Done | Step |
|---|---|
| Count the replicas and the time a request takes at the 99th percentile. The stop timer must be longer than thatO. | |
| Remove one replica from the router first. Then wait for in flight requests. Then stop it (E7: drain then stop failed none)M. | |
| Check what the app does on SIGTERM: stop accepting, finish in flight, exit. An app that exits at once drops what it holdsO. | |
| If the router can retry, check that the requests it retries are idempotent. Only GETs were testedM. | |
| Count database connections held after SIGTERM. This was not measured hereO. | |
| Restart one replica, check the failed request count, then the next. Keep the old version until the last one is healthyO. |
Appendix C
Raw tables§
These are the tables of the results file for the two runs, with the columns trimmed to those the text uses. Cells are the median over repetitions. Ranges are in the results file. Column Ver is the PostgreSQL major version. The full records are in the experiments directory of the published repository [1].
C.0.1 E1. Lock queue behind a long transaction§
Stall and p99 are in seconds and milliseconds. Blocked is the number of backends waiting on a lock, sampled once 2 s after the ALTER started, not a peak over time.
| Ver | Variant | Stall s | p99 ms | ALTER wait ms | Blocked, sampled once | tps |
|---|---|---|---|---|---|---|
| 16 | alter behind idle in tx | 5.014 | 4874.1 | 5010.3 | 9 | 498.8 |
| 16 | alter behind long tx | 5.008 | 4862.3 | 5005.7 | 9 | 501.1 |
| 16 | alter no long tx | 0.023 | 5.67 | 0.366 | 0 | 499.1 |
| 16 | baseline | 0.02 | 4.45 | - | - | 497.4 |
| 17 | alter behind idle in tx | 5.002 | 4868.6 | 4999.7 | 9 | 499 |
| 17 | alter behind long tx | 5.012 | 4890 | 5009.4 | 9 | 501.7 |
| 17 | alter no long tx | 0.024 | 5.21 | 0.308 | 0 | 500.1 |
| 17 | baseline | 0.022 | 4.59 | - | - | 494.8 |
C.0.2 E2. lock_timeout with retry§
Attempts is the number of tries before the ALTER landed. n/p means not printed: the 50 ms attempts and p99 on 16.15 disagreed between the runs by more than the tolerance (attempts ranged from 1 to 14), so only the stall and its direction are given. The give up arm ended with the column absent by design.
| Ver | Variant | Stall s | p99 ms | Attempts | To success s |
|---|---|---|---|---|---|
| 16 | lock timeout 1000ms | 1.008 | 959.9 | 4 | 5.05 |
| 16 | lock timeout 200ms | 0.213 | 188.7 | 10 | 5.04 |
| 16 | lock timeout 200ms gives up | 0.213 | 175.2 | 5.5 | 3.34 |
| 16 | lock timeout 3000ms | 3.004 | 2871.5 | 2 | 5.045 |
| 16 | lock timeout 50ms | 0.061 | n/p | n/p | 5.205 |
| 17 | lock timeout 1000ms | 1.009 | 960.5 | 4 | 5.335 |
| 17 | lock timeout 200ms | 0.211 | 188.5 | 10 | 5.065 |
| 17 | lock timeout 200ms gives up | 0.213 | 183.3 | 6 | 3.33 |
| 17 | lock timeout 3000ms | 3.005 | 2876.5 | 2 | 5.05 |
| 17 | lock timeout 50ms | 0.065 | 44.7 | 14 | 5.24 |
C.0.3 E3. ADD COLUMN default§
Three million rows, 298 MB before. Rewritten is whether the file node changed.
| Ver | Variant | DDL ms | Rewritten | Stall s | MB before | MB after |
|---|---|---|---|---|---|---|
| 16 | constant default | 0.582 | no | 0.02 | 298 | 298 |
| 16 | nullable no default | 0.347 | no | 0.019 | 298 | 298 |
| 16 | volatile default | 1035.9 | yes | 1.027 | 298 | 321 |
| 17 | constant default | 0.636 | no | 0.019 | 298 | 298 |
| 17 | nullable no default | 0.324 | no | 0.02 | 298 | 298 |
| 17 | volatile default | 962.5 | yes | 0.955 | 298 | 321 |
C.0.4 E4. CREATE INDEX§
Two million rows. Failed counts pgbench clients that hit an error. The 17.11 concurrent build time is one of the twelve comparisons outside tolerance.
| Ver | Variant | DDL ms | Stall s | p99 ms | Failed | tps |
|---|---|---|---|---|---|---|
| 16 | baseline | - | 0.019 | 4.555 | 0 | 497.8 |
| 16 | concurrently with old tx | 13997.9 | 0.022 | 4.485 | 0 | 499.1 |
| 16 | create index | 1147.7 | 1.148 | 885.7 | 0 | 498.8 |
| 16 | create index concurrently | 1386.4 | 0.025 | 4.955 | 0 | 498.1 |
| 16 | failed concurrently leaves invalid | - | 0.02 | 4.46 | 0 | 498.6 |
| 17 | baseline | - | 0.022 | 4.93 | 0 | 500.1 |
| 17 | concurrently with old tx | 13986.6 | 0.026 | 4.745 | 0 | 499.9 |
| 17 | create index | 1198.3 | 1.202 | 948.8 | 0 | 500.6 |
| 17 | create index concurrently | 1400.9 | 0.038 | 8.025 | 0 | 499.3 |
| 17 | failed concurrently leaves invalid | - | 0.026 | 4.735 | 0 | 500.6 |
C.0.5 E5. Constraints§
n/p means not printed: the foreign key arms are among the limited rows, and we print their stall only. Statement times of the NOT VALID path are among the twelve outside tolerance.
| Ver | Variant | DDL ms | Stall s | p99 ms | tps |
|---|---|---|---|---|---|
| 16 | add check blocking | 81.8 | 0.086 | 4.97 | 496.8 |
| 16 | add check not valid then validate | 80.2 | 0.023 | 4.205 | 501.4 |
| 16 | add fk blocking | n/p | 0.332 | n/p | 501.1 |
| 16 | add not valid then validate | n/p | 0.022 | n/p | 500.6 |
| 16 | baseline | - | 0.019 | 4.465 | 498.2 |
| 16 | no ddl control | 0.1 | 0.021 | 4.36 | 502.4 |
| 16 | not valid enforcement | - | - | - | - |
| 16 | set not null direct | 64.2 | 0.067 | 4.54 | 497.8 |
| 16 | set not null via validated check | 84.5 | 0.022 | 4.26 | 499.9 |
| 17 | add check blocking | 105.9 | 0.108 | 3.61 | 498.7 |
| 17 | add check not valid then validate | 98 | 0.022 | 3.585 | 496.7 |
| 17 | add fk blocking | n/p | 0.233 | n/p | 498.1 |
| 17 | add not valid then validate | n/p | 0.024 | n/p | 502.1 |
| 17 | baseline | - | 0.019 | 3.885 | 505.9 |
| 17 | no ddl control | 0.1 | 0.023 | 4.105 | 501.1 |
| 17 | not valid enforcement | - | - | - | - |
| 17 | set not null direct | 100.9 | 0.104 | 3.98 | 495.1 |
| 17 | set not null via validated check | 62.8 | 0.028 | 4.805 | 497.1 |
C.0.6 E6. Rename under load§
Failed counts the clients that hit an error, at most six. The p99 of these arms is not printed (n/p): three of the comparisons were outside tolerance.
| Ver | Variant | Failed | Aborted | Tx ok | Stall s | p99 ms |
|---|---|---|---|---|---|---|
| 16 | expand contract | 0 | 0 | 22966.5 | 0.031 | n/p |
| 16 | naive rename | 6 | 6 | 1486.5 | 0.028 | n/p |
| 17 | expand contract | 0 | 0 | 22999.5 | 0.023 | n/p |
| 17 | naive rename | 6 | 6 | 1524 | 0.014 | n/p |
C.0.7 E7. Stopping one of two replicas§
Counts are real requests out of 1920 per arm. A negative first failure time means the request had started before the stop command. A dash means no failure.
| Ver | Variant | Requests | Failed | First fail s | Last fail s | p99 ms |
|---|---|---|---|---|---|---|
| - | drain then stop | 1920 | 0 | - | - | 311 |
| - | kill | 1920 | 12 | −0.31 | −0.035 | 309.5 |
| - | kill proxy retry | 1920 | 0 | - | - | 309 |
| - | stop without deregister | 1920 | 1 | −0.01 | −0.01 | 309 |
| - | stop without deregister proxy retry | 1920 | 0 | - | - | 307.5 |
Glossary§
- ACCESS EXCLUSIVE
- The strongest PostgreSQL table lock. Most ALTER TABLE forms take it, and it conflicts with every other mode, including the ACCESS SHARE a plain SELECT holds.
- Backfill
- Filling a new column for existing rows, usually in batches so that no single statement holds a lock for long.
- Concurrent index build
- CREATE INDEX CONCURRENTLY, which builds an index without blocking writes, at the cost of more passes over the table and a wait for older transactions.
- Contract
- The last step of expand and contract: removing the old column or object once no app version uses it. Rollback is no longer clean after it.
- Draining
- Taking an instance out of rotation, letting in-flight requests finish, then stopping it.
- Expand and contract
- A change shipped as four steps (expand, backfill, deploy, contract), each compatible with the old and the new app version: add the new shape, move data and readers, remove the old shape. Also called parallel change.
- Lock queue
- The ordered line of requests waiting for a lock. A request that waits for a strong lock also holds back the weaker requests that arrive after it.
- lock_timeout
- A PostgreSQL setting that cancels a statement that waits longer than the given time to get a lock. It applies to each acquisition, and PostgreSQL does not retry for you.
- NOT VALID
- A constraint added without checking existing rows. New writes are checked at once, and VALIDATE CONSTRAINT checks the old rows later under a weaker lock.
- Rewrite
- A change that copies the whole table into new files while holding a strong lock, so the lock lasts as long as the copy.
- Stall
- In this paper, the longest gap in seconds between two consecutive completed transactions in the load generator’s log. About 0.02 s with no DDL at 500 transactions per second.
- tmpfs
- A RAM-backed file system. The lab database lived on it, so times are a shape, not production times.
References§
- GLINR Studios. GLINR-WP-2026-501 experiments and results. 2026.
- GoCardless. Zero-downtime Postgres migrations, the hard parts. gocardless.com/blog/zero-downtime-postgres-migrations-the-hard-parts/ Accessed Nov 11, 2026.
- PostgreSQL Global Development Group. PostgreSQL documentation: Explicit Locking. 2026. www.postgresql.org/docs/current/explicit-locking.html Accessed Nov 11, 2026.
- GitLab. Migration style guide. 2026. docs.gitlab.com/development/migration_style_guide/ Accessed Nov 11, 2026.
- PostgreSQL Global Development Group. PostgreSQL documentation: ALTER TABLE. 2026. www.postgresql.org/docs/current/sql-altertable.html Accessed Nov 11, 2026.
- PostgreSQL Global Development Group. PostgreSQL documentation: CREATE INDEX. 2026. www.postgresql.org/docs/current/sql-createindex.html Accessed Nov 11, 2026.
- PostgreSQL Global Development Group. PostgreSQL documentation: System Information Functions. 2026. www.postgresql.org/docs/current/functions-info.html Accessed Nov 11, 2026.
- Slot, Marco. 7 tips for dealing with Postgres locks. Citus Data. 2018. www.citusdata.com/blog/2018/02/22/seven-tips-for-dealing-with-postgres-locks/ Accessed Nov 11, 2026.
- Xata. Schema changes and the Postgres lock queue. xata.io/blog/migrations-and-exclusive-locks Accessed Nov 11, 2026.
- PostgreSQL Global Development Group. PostgreSQL documentation: Client Connection Defaults. 2026. www.postgresql.org/docs/current/runtime-config-client.html Accessed Nov 11, 2026.
- Kane, Andrew. strong_migrations README. github.com/ankane/strong_migrations Accessed Nov 11, 2026.
- PostgreSQL Global Development Group. PostgreSQL 11 release notes. 2018. www.postgresql.org/docs/release/11.0/ Accessed Nov 11, 2026.
- Squawk. Squawk rules index. 2026. squawkhq.com/docs/rules Accessed Nov 11, 2026.
- Sato, Danilo. Parallel Change. martinfowler.com. 2014. martinfowler.com/bliki/ParallelChange.html Accessed Nov 11, 2026.
- Fowler, Martin, Sadalage, Pramod. Evolutionary Database Design. martinfowler.com. 2016. martinfowler.com/articles/evodb.html Accessed Nov 11, 2026.
- Xu, Jacqueline. Online migrations at scale. Stripe. 2017. stripe.com/blog/online-migrations Accessed Nov 11, 2026.
- Fowler, Martin. Blue Green Deployment. martinfowler.com. 2010. martinfowler.com/bliki/BlueGreenDeployment.html Accessed Nov 11, 2026.
- Xata. pgroll README. GitHub. 2026. github.com/xataio/pgroll Accessed Nov 11, 2026.
- Docker Inc.. docker container stop. Docker Docs. 2026. docs.docker.com/reference/cli/docker/container/stop/ Accessed Nov 11, 2026.
- The Kubernetes Authors. Pod Lifecycle, termination of Pods. Kubernetes Documentation. 2026. kubernetes.io/docs/concepts/workloads/pods/pod-lifecycle/ Accessed Nov 11, 2026.
- The Kubernetes Authors. EndpointSlices. Kubernetes Documentation. 2026. kubernetes.io/docs/concepts/services-networking/endpoint-slices/ Accessed Nov 11, 2026.
- The Kubernetes Authors. Performing a Rolling Update. Kubernetes Documentation. 2026. kubernetes.io/docs/tutorials/kubernetes-basics/update/update-intro/ Accessed Nov 11, 2026.
- Amazon Web Services. Target groups for your Application Load Balancers, edit target group attributes. AWS Documentation. 2026. docs.aws.amazon.com/elasticloadbalancing/latest/application/edit-target-group-attributes.html Accessed Nov 11, 2026.
- Xata. Zero-downtime schema migrations in PostgreSQL. xata.io/blog/zero-downtime-schema-migrations-postgresql Accessed Nov 11, 2026.
Disclosure and method§
- Interests
- GLINR Studios builds Levelrail, a self-hosted deployment platform. No product is recommended in this paper. PostgreSQL and nginx appear only as test subjects, with versions.
- Funding
- No external funding. This is the studio's own open-source work, paid for by the studio.
- Review
- Not externally reviewed.
- License
- CC BY 4.0
Revisions
| Version | Date | What changed |
|---|---|---|
| 0.1.0 | First draft. |
Corrections
No corrections so far. Found an error? Write to support@glinr.com: corrections are made in public and recorded here with the old and new wording.
Cite this paper§
GLINR Studios. (2026). Zero-Downtime Migrations, Tested: Lock queues, expand and contract and rolling restarts, measured on Postgres 16 and 17 and nginx (Working paper No. GLINR-WP-2026-501, Version 0.1.0). https://glinr.com/research/2026-501-zero-downtime-migrations@techreport{glinr2026wp501,
author = {{GLINR Studios}},
title = {Zero-Downtime Migrations, Tested: Lock queues, expand and contract and rolling restarts, measured on Postgres 16 and 17 and nginx},
institution = {GLINR Studios},
type = {Working paper},
number = {GLINR-WP-2026-501},
year = {2026},
month = nov,
version = {0.1.0},
url = {https://glinr.com/research/2026-501-zero-downtime-migrations}
}TY - RPRT
AU - GLINR Studios
TI - Zero-Downtime Migrations, Tested: Lock queues, expand and contract and rolling restarts, measured on Postgres 16 and 17 and nginx
PY - 2026
DA - 2026/11/11
PB - GLINR Studios
M3 - Working paper
SN - GLINR-WP-2026-501
ET - 0.1.0
AB - A one line ALTER TABLE runs in milliseconds, yet it can stall every query on the table for as long as an unrelated transaction stays open. This paper measures that on PostgreSQL 16.15 and 17.11 with a pgbench workload at a fixed rate, then tests lock_timeout with retry, changes that rewrite or scan a table, concurrent indexes, NOT VALID constraints, a rename done in one step versus expand and contract, and a rolling restart behind nginx 1.27.2. A queued ADD COLUMN stalled all reads for about 5 s, and lock_timeout cut each stall to about the timeout. An ordered procedure is derived from the steps, not measured as a whole. The database ran on tmpfs with scaled data, so every time is a shape, not a production time. Replicas, managed services, Kubernetes and migration tools were not tested. The harness and raw results are published at release.
KW - zero downtime migration
KW - Postgres lock queue
KW - lock_timeout retry
KW - expand and contract
KW - CREATE INDEX CONCURRENTLY
KW - NOT VALID constraint
KW - rolling restart
KW - connection draining
UR - https://glinr.com/research/2026-501-zero-downtime-migrations
LA - en
ER -cff-version: 1.2.0
message: "If you use this paper, please cite it as below."
type: report
title: "Zero-Downtime Migrations, Tested: Lock queues, expand and contract and rolling restarts, measured on Postgres 16 and 17 and nginx"
authors:
- name: "GLINR Studios"
version: "0.1.0"
date-released: "2026-11-11"
identifiers:
- type: other
value: "GLINR-WP-2026-501"
url: "https://glinr.com/research/2026-501-zero-downtime-migrations"
license: CC-BY-4.0
keywords:
- "zero downtime migration"
- "Postgres lock queue"
- "lock_timeout retry"
- "expand and contract"
- "CREATE INDEX CONCURRENTLY"
- "NOT VALID constraint"
- "rolling restart"
- "connection draining"
abstract: "A one line ALTER TABLE runs in milliseconds, yet it can stall every query on the table for as long as an unrelated transaction stays open. This paper measures that on PostgreSQL 16.15 and 17.11 with a pgbench workload at a fixed rate, then tests lock_timeout with retry, changes that rewrite or scan a table, concurrent indexes, NOT VALID constraints, a rename done in one step versus expand and contract, and a rolling restart behind nginx 1.27.2. A queued ADD COLUMN stalled all reads for about 5 s, and lock_timeout cut each stall to about the timeout. An ordered procedure is derived from the steps, not measured as a whole. The database ran on tmpfs with scaled data, so every time is a shape, not a production time. Replicas, managed services, Kubernetes and migration tools were not tested. The harness and raw results are published at release."