---
title: "DNS in Production"
subtitle: "TTLs, failover and failure modes, measured in two resolvers and four client runtimes"
description: "A DNS change takes effect when several independent clocks expire, and the TTL you set is only one of them."
author: "GLINR Studios"
date: 2026-11-11
updated: 2026-11-11
version: "0.1.0"
report_id: "GLINR-WP-2026-301"
canonical_url: https://glinr.com/research/2026-301-dns-in-production
license: "CC BY 4.0"
tags: ["DNS TTL", "DNS failover", "negative caching", "serve-stale", "resolver TTL clamping", "DNS cutover time", "client DNS caching", "delegation", "RFC 2308", "RFC 8767"]
---
_Canonical version: https://glinr.com/research/2026-301-dns-in-production_
# DNS in Production
_TTLs, failover and failure modes, measured in two resolvers and four client runtimes_
**GLINR-WP-2026-301** · GLINR Studios · 0.1.0 · 2026-11-11
## Abstract
A DNS change takes effect when several independent clocks expire, and the TTL you set is only one of them. This paper measures the others in a Docker lab with two resolvers, Unbound 1.22.0 and BIND 9.20.30, and four client runtimes: Python, Go, curl and Java. Both resolvers honored configured TTL floors and caps. The cache part of a cutover equaled the remaining TTL to within about 1 s, and lowering a TTL only at the moment of change barely helped. Serve-stale kept answering for the configured window in Unbound, and intermittently in BIND. Client runtimes differed widely in how long they kept the old address and in whether they tried a second address when the first was dead. The paper reads the 2025 AWS DynamoDB outage against these clocks, and ends with a TTL policy, a pre-change runbook and a monitoring checklist. The authoritative server is a custom lab server, so every figure is indicative and a lower bound for a real cutover. The harness and raw results are published.
## Key findings
1. **Floors and caps do what they say.** Unbound 1.22.0 and BIND 9.20.30 raised a 5 s record to about 15 s with a 15 s floor and cut a 20 s record to about 8 s with an 8 s cap, within 0.9 s of expected. M
2. **The wire TTL decides how long a miss lasts.** Behind a compliant reply, a negative answer was cached about 5.9 s (BIND) and 6.9 s (Unbound) with SOA TTL 30 s and MINIMUM 6 s. With an unlowered SOA TTL on the wire, BIND followed it (about 29.9 s), Unbound the lower value (lab-mode). M
3. **Serve-stale extends service by its window.** With a 5 s TTL and a 15 s stale window, Unbound kept answering until about 20 s after the cache fill. BIND's last success was about 19 s, but intermittent. Without serve-stale, both stopped at the TTL. M
4. **Lower the TTL one old TTL ahead.** With a 20 s TTL, lowering it to 2 s right before the change left a stale window of about 18 to 19 s. Lowering it one old TTL ahead cut the window to about 2 s or less. M
5. **Clients keep the old address much longer.** With a 2 s record TTL, OpenJDK 21.0.13 held the old address about 30 s by default and one long-lived curl process about 56 s. A new curl process per request moved in about 1.8 s. M
6. **A second address is not a fallback for every client.** With the first of two addresses refusing connections, Python, Go and curl reached the second within about 0.25 s. A Java HttpURLConnection client failed instead. M
## Preface
When a DNS change is slow to take effect, the usual answer is “wait for the TTL”. That answer is incomplete. The TTL is one clock among several: the resolver may raise or cut it, a miss is cached on its own timer, a failed lookup can be cached too, and the client may hold the address for longer than any of them. In our lab, a Java client given a record with a 2 s TTL kept using the old address for about 30 s [1]M.
So this paper measures the clocks, one at a time, and then adds them up. The lab is small: two resolvers, Unbound 1.22.0 and BIND 9.20.30, four client runtimes (Python, Go, curl and Java) and a custom scriptable authoritative server. That limits what we can say. Other resolvers appear only through their documentation, and we label those figures as sourced, not measured. Every measured number is indicative, from one laptop with emulated images, and a lab figure is a lower bound for a real cutover.
We wrote it for the engineer who owns a zone or a failover design for a small or mid-sized service, and for whoever is paged when DNS is slow to switch. You need `dig` and a shell. It is not aimed at registry or large public-resolver operators.
> **How to read this**
>
> Chapter 1 gives the model: every hop holds a copy with its own expiry. After that, jump to the chapter that matches the worry in front of you. Each one opens with a question and ends with key takeaways and a check you can run this week. The appendices hold the method, three checklists and the raw tables. The small tags after claims say how each is known: M measured by us, S sourced, D derived, O opinion.
## Chapter 1: A DNS answer is a cached copy
**Why does a change you made at the authoritative server not reach every user at the same moment?**
AWS’s summary of its DynamoDB disruption in October 2025 gives the cause as “a latent race condition in the DynamoDB DNS management system” that left the regional endpoint with no IP addresses. DNS failures began at 11:48 PM PDT on 19 October. DNS information was restored at 2:25 AM, and DynamoDB recovered at 2:40 AM, after cached DNS records had expired [2]S. The fix was in place at 2:25. The service was not back until 2:40.
Those 15 minutes are the subject of this paperD. Everything between your zone file and a user’s connection holds a copy of your answer, and each copy has its own expiry. Editing the zone changes one copy. Users keep seeing the others until they run out.
### 1.1 Where the 15 minutes went
The arithmetic is short. From 11:48 PM to 2:40 AM is 2 hours 52 minutes of DNS-caused errors. From the restored DNS information at 2:25 AM to recovery at 2:40 AM is 15 minutes, which is about 9 percent of the totalD. The postmortem does not break that tail into resolver caching and client behaviour [2]S. We will not allocate it either: nobody outside AWS can, and any split would be a guess.
InfoQ’s report of the postmortem quotes the engineer Yan Cui saying that DNS was the first symptom, not the root cause [3]S. That is his view, and AWS’s own account fits it, since the failure was an automation fault in the system that writes DNS recordsO. Chapter 8 returns to that. This chapter is about the other half of the story: once the records were right again, how long did it take for everyone to see them?
> Fixing the zone fixes one copy of the answer.
### 1.2 What the standards promise
The standards are consistent on the basic idea and loose on the rest. RFC 1034 says the TTL is a time limit on caching, set by the zone administrator, and that the administrator may lower it before an anticipated change [4]S. RFC 1035 says a TTL of zero means the record is used only for the transaction in progress [5]S. RFC 2181 limits a TTL to the range 0 through 2147483647, says a value with the most significant bit set is treated as zero, and describes the TTL as a maximum time to live, not a mandatory one [6]S.
Three consequences follow, and the rest of the paper depends on them.
- A TTL is a ceiling. The limit is on how long a copy may be kept, and the RFC wording does not promise that every cache keeps it that long.
- The records of one set expire together. RFC 2181 requires equal TTLs inside an RRSet and says to use the lowest if they differ [6]S. Mixing TTLs in one set buys nothing.
- The zone owner is not the only author. RFC 2181 also ranks authoritative answers above data from the additional section, so what a resolver keeps depends on where it learned the record [6]S.
The RFCs are not a perfect guide either. RFC 1035 treats the TTL as signed in one section and unsigned in another [5]S. A TTL is one number in the zone file and a family of behaviours on the wire. Chapter 2 separates them.
### 1.3 The path of copies
The figure draws the path a lookup takes. Every box that can answer from memory is a copy, and a miss moves one hop onward. The drawing is a model. It attaches no number to any hop, because chapters 2 to 6 measure the clocks one at a time and some of them we did not measure.
_Figure 1.1. Every hop that can answer from memory keeps its own copy and its own expiry. Editing the primary changes one copy. The orange box is the layer that held the old address for 30 s in Java’s default; a long-lived curl process held it for about 60 s._
Not every hop exists in every deployment, and some hops are several. A stub resolver on the host may be a caching service: the systemd-resolved manual describes a caching and validating stub whose caches are flushed on a network configuration change and on SIGHUP [7]S. The manual page says little about how it treats TTLs, so we make no claim about its clamping. The OS layer is a cache with its own lifecycle, and you may have to flush it.
### 1.4 One change, four runtimes
We wanted to see whether the layer closest to the application matters in practice. The setup was small. A record had a TTL of 2 s at a caching resolver in the lab. About 3.5 s after the first lookup we changed the answer at the authoritative server. A client then sent one request every 0.5 s, each on a new connection, and we logged when the new address first appeared [8]M. The resolver side was Unbound 1.22.0 in this test, and the client runs were Python 3.12.16, Go 1.23.12 (both resolver modes), curl 7.88.1 and OpenJDK 21.0.13.
| Client | Setting | New address first used, seconds after the change |
| --- | --- | --- |
| Python (urllib), Go (pure and cgo), new curl process per request | Defaults | 1.76 to 2.45 |
| curl, one long-lived process | Default in-process DNS cache | 55.66 |
| Java 21 `HttpURLConnection` | Default | 26.66 |
| Java 21 | `networkaddress.cache.ttl=5` | 1.38 |
| Java 21 | `networkaddress.cache.ttl=0` | 1.68 |
| Java 21 | `networkaddress.cache.ttl=-1` | Not within the 45 s run |
The first row is the baseline. With no client-side cache, the switch followed the 2 s resolver TTL plus the 0.5 s request interval, and the 31 requests of each run produced no errors [8]M. The other rows show a second clock laid on top. The Java default held the old address for about 30 s from the first lookup, although the record said 2 s. The long-lived curl process held it for about 60 s from the first lookup, which is the size of its DNS cache, and curl 7.88.1 has no command line option to change that. With the Java cache property at −1 it did not switch in 45 s. We do not claim that it never would, only that the run ended first [8]M.
Two limits matter. The Java default is a property of this build, not of Java in general: the Java SE 21 documentation leaves the caching period to the implementation, so read our 26.66 s as a measurement of OpenJDK 21.0.13 in this labM. And every request used a new connection. A client that keeps one connection open does not look the name up again while it stays open, which is a different failure that we describe in chapter 6 from vendor documentation only, without measuring it.
> **Common trap**
>
> Lowering the TTL at the authoritative server does nothing for a client that cached the answer by its own rules. If the client holds the address for 30 s, a 2 s TTL is decoration.
### 1.5 Cutover is the remaining TTL
The resolver in the middle, in our lab, did what the RFC wording suggests. Both Unbound 1.22.0 and BIND 9.20.30 served a record for about its TTL: 5 s and 20 s records were cached for about 5.3 s and 20.9 s (Unbound) and 4.9 s and 20.1 s (BIND) [8]M. After we flipped the authoritative answer, a resolver kept serving the old address for about the time left on the cache entry. Across TTLs of 3, 6 and 12 s, flipped at 10, 50 and 90 percent of the TTL, measured minus expected stayed within 0.95 s for Unbound and 0.72 s for BIND, and a TTL of 0 was visible at once [8]M.
So a user’s wait depends on when the user’s resolver last filled its cache, which you do not know. A record with a 12 s TTL flipped 1.2 s after the fill took about 11.6 s to show in Unbound and 10.1 s in BIND. The same flip at 10.8 s took 1.8 s and 1.1 s [8]M. The unit of cutover is a range, from nothing to one TTL, per resolver in the path.
The figures come from a lab: one laptop clock, loopback-class latency, a synthetic authoritative server, linux/amd64 images emulated on an arm64 host, so every timing carries a few hundred milliseconds of overhead. Two runs agreed to within 0.86 s at most. Treat the lab numbers as a lower bound for a real cutoverM. What we did not measure here is the detection side: the lab has no health checker, so how long a failure takes to be noticed is not in these numbers. Chapter 5 builds that term from provider documentation and marks it as derived.
### 1.6 Prove it on your own zone
Before the next change, look at one copy yourself. Ask your resolver for a record you own without letting it recurse:
```bash
dig +norecurse www.example.com A @your-resolver
```
If the resolver has the answer, the TTL column is the time it has left, not the value in your zone. Run it twice a few seconds apart and watch it count down. Write down the remaining TTL, the value in the zone, and the resolver you askedO. If you can name the hops in the figure for one real client, you can say where your own change will wait.
> **What would change our mind**
>
> If clients without their own cache were common and runtimes kept their caches short, the resolver TTL would be the only clock that matters. Our four runtimes give a mixed picture, and we tested no others, so the claim stays small: the TTL is one of several clocks.
> **Key takeaways**
>
> - A TTL is a ceiling set by the zone owner, and every hop between you and the user holds its own copy with its own expiry. RFC 2181 calls it a maximum, not a mandate.
> - In our lab a resolver served the old address for about the time left in its cache, and a client runtime added its own clock on top: about 30 s for one Java build, about 56 s for a long-lived curl process, against a 2 s record.
> - The AWS 2025 tail was 15 minutes after DNS was restored, out of 2 h 52 min of errors. The postmortem does not say how much of it was caching, so nobody outside AWS can.
## Chapter 2: The five clocks
**Which timers decide when a new DNS answer becomes visible, and which of them do you control?**
_In the model of chapter 1: every cached copy has its own expiry. This chapter lists the expiries a resolver keeps._
The TTL is the clock people know. It is also the only one the zone owner sets directly. A resolver runs at least four more, and each has its own default, its own cap and its own failure mode. When someone says “DNS is slow to switch”, the answer is usually one of the other four.
This chapter names the five clocks, prints what the standards and four resolver manuals say about each, and then shows what two resolvers did with them in our lab. The two were Unbound 1.22.0 and BIND 9.20.30, both in Docker 29.8.2 on one arm64 laptop, with linux/amd64 images emulated [8]M. We did not run PowerDNS, CoreDNS or dnsmasq. Their numbers below come from their documentation, read on 2026-11-11, and are labelled that way.
### 2.1 The clocks
1. **Positive TTL, then the clamp.** How long an existing answer is reused. The authoritative server sets the TTL, and the resolver may raise it to a floor or lower it to a cap before it counts.
2. **Negative TTL.** How long “this name, or this type, does not exist” is reused.
3. **Failure cache.** How long “we could not get an answer at all” is reused, so a broken server is not asked again at once.
4. **Stale window.** How long an expired copy may still be handed out when a refresh fails.
5. **Parent or child NS TTL.** How long the resolver believes the delegation, which decides whose servers it asks next.
_Figure 2.1. One lookup, five clocks. The positive and negative clocks start from an answer. The failure cache and stale window start when no answer comes. The delegation clock starts before any of them, because it decides who is asked._
Only the first and, through the SOA record, the second are set in your zone. The failure cache and the stale window are resolver policy. The fifth depends on a copy of your data that lives in your parent zone and which you may not control at all.
### 2.2 What the standards and the manuals say
RFC 2308 section 5 sets the negative TTL from the lower of the SOA MINIMUM field and the TTL of the SOA record itself [9]S. It suggests capping negative caching at 1 to 3 hours and says values over one day have been found to be problematicS. Section 8 makes negative caching mandatory for caching resolversS.
RFC 9520 requires resolvers to cache resolution failures for at least 1 second and at most 5 minutes, and says they should back off [10]S. RFC 8767 requires a stale TTL above zero and recommends 30 seconds. It suggests a 1.8 second client response timer and a maximum stale time of 1 to 3 days, and says not to retry a failed refresh more often than every 30 seconds [11]S. Those are RFC values. Nothing in this chapter measured them.
For the TTL itself, Moura et al. (IMC 2019) and RFC 9199 both recommend at least 1 hour for general zones. They say about 5 to 15 minutes only suits DNS load balancing or DDoS redirection [12, 13]S. In the same paper a ccTLD saw its median latency fall from 183 ms to 28.7 ms after lengthening its TTL, and a controlled test compared 60 s with 86,400 s from about 15,000 Atlas probes [12]S. Moura et al. do not recommend a TTL of 0S. They also report that many resolvers applied a minimum caching time of tens of seconds in their 2019 measurements, so a short TTL is a request, not a guaranteeS.
The implementations then fill in what the standards leave open. Table 2.1 sets four manuals side by side.
| Clock | Unbound | PowerDNS Recursor | CoreDNS cache | dnsmasq |
| --- | --- | --- | --- | --- |
| Positive cap | 86400 s | 86400 s | 3600 s | n/l |
| Floor | 0 s | 1 s | 5 s | `--min-cache-ttl`, max 1 h |
| Negative cap | 3600 s | 3600 s | 1800 s | `--neg-ttl`, no-SOA only |
| Failure cache | n/l | 60 s | 5 s | n/l |
| Stale | off, 86400 s, reply 30 s | n/r | 1 h, reply 0 s | n/l |
_Table 2.1. Documented defaults, read from each project’s manual on 2026-11-11. Sourced, not measured: the versions in the manuals were the current online ones, not necessarily the versions anyone runs. n/l: not listed in the part we read. n/r: section not read. The PowerDNS settings are `minimum-ttl-override` and `packetcache-servfail-ttl`. dnsmasq keeps its floor under 1 h unless recompiled; `--neg-ttl` applies only to replies without an SOA._ Sources: Unbound [14], PowerDNS [15], CoreDNS [16], dnsmasq [17]S.
Read across a row and the problem shows. The positive cap is 86400 s in two resolvers and 3600 s in a third. The negative cap is 3600 s in two and 1800 s in oneS. The floor is 0, 1 or 5 seconds. Per the manuals we read, a record set to 10 seconds is cached for 10 seconds by Unbound, PowerDNS and CoreDNS, and a record set to 2 seconds is held for 5 seconds by CoreDNSS. CoreDNS documents a stale TTL of 0 for stale answers, where RFC 8767 requires a value above zero, so check the version you run before relying on eitherS. dnsmasq documents `--neg-ttl` as a fallback for replies with no SOA, so an operator who sets it and expects it to bound negative caching in general has read it wrongS.
We have no table row for BIND, on purpose. The BIND reference lists the option names (`max-cache-ttl`, `max-ncache-ttl`, `min-cache-ttl`, `stale-answer-enable`, `max-stale-ttl` and others) [18]S. We read only the 9.20.0 text for `max-ncache-ttl` and `min-ncache-ttl` (chapter 3). We did not read the stale options or the TTL cap and floor, so Table 2.1 has no BIND row. Where BIND appears below, the number was measured.
> **Common trap**
>
> A published default belongs to a version. Print the version next to any number you copy into a design document, and re-read the manual when you upgrade. Every default in Table 2.1 is a claim about a manual on one date.
### 2.3 Clock 1: the TTL and its clamp
Both resolvers honored the TTL we set, and both honored a floor and a cap when we configured one (`cache-min-ttl 15` and `cache-max-ttl 8` in Unbound, `min-cache-ttl 15` and `max-cache-ttl 8` in BIND)M. With the floor, the first reply carried TTL 15. In each case the authoritative server was asked twice, once at the first lookup and once after expiry. Readings are “about”: poll step 0.2 s, whole-second TTL counting.
| Case (record TTL) | Expected | Unbound 1.22.0 | BIND 9.20.30 | Behaviour |
| --- | --- | --- | --- | --- |
| Default (5 s) | 5 s | 5.3 s | 4.9 s | honored |
| Default (20 s) | 20 s | 20.9 s | 20.1 s | honored |
| Floor 15 s (5 s) | 15 s | 15.2 s | 14.5 s | clamped up |
| Cap 8 s (20 s) | 8 s | 8.9 s | 7.2 s | clamped down |
_Table 2.1. Measured cache time of one record, in seconds. Poll step 0.2 s, tolerance minus 1.2 s to plus 1.5 s, all 8 cases inside itM. Two TTL values only. Resolver configuration is listed in Appendix A._
This is a narrow result. We tested two TTL values and two clamp settings, not a grid of TTLs from 0 to 2147483647, and we did not test any default floor of another resolver. Each resolver landed within 0.9 s of the expected value, and the two differed from each other by up to 1.7 s (the 8 s cap: 8.9 s in Unbound, 7.2 s in BIND)M.
The floor is a policy of whoever runs the resolver, and a client behind a resolver with a 5 second floor does not get your 2 second TTL. Moura et al. saw the same thing at internet scale in 2019, so we treat the floor as a fact of life, not a misconfigurationS.
### 2.4 Clock 2: the negative TTL
The negative TTL is the clock that catches people creating a new record. A lookup that returns NXDOMAIN is cached, and a record created a second later stays invisible for the negative TTL. RFC 2308 says NXDOMAIN is cached by name and class, and NODATA by name, type and class [9]S. The duration is the lower of the SOA TTL and the SOA MINIMUM.
In our lab, with an SOA TTL of 30 s and a MINIMUM of 6 s, and an authoritative that put the lowered value on the wire as RFC 2308 section 5 expects, BIND cached the NXDOMAIN for about 5.9 s and Unbound for about 6.9 s, and both showed TTL 6 on the first replyM. With SOA TTL and MINIMUM both 8, Unbound cached for about 8.6 s and BIND for about 7.8 sM. A resolver cap on negative answers was honored too: with a 3 s cap, a 20 s negative answer lasted about 3.6 s in Unbound and about 2.3 s in BINDM. In every case the name we created right after its first NXDOMAIN stayed invisible for roughly the negative TTLM. Chapter 3 works the rest.
The lab also produced a finding that needs care. When our test authoritative sent the SOA with its full TTL of 30 s (or 60 s) in the authority section and a MINIMUM of 6 s, a reply a compliant server would not send, Unbound still answered with TTL 6 and cached for about 6.9 s, while BIND cached for about 29.9 s (about 59.9 s)M. That is lab-mode behavior: it depends on the shape of a reply built by a custom scriptable server, and with a compliant reply BIND gave 5.9 s. It is not a claim that BIND ignores the MINIMUM, and not a claim about any production authoritative. What it does show is that “the negative TTL is min(TTL, MINIMUM)” is something two implementations can disagree about when the wire data is not clean, and you only discover which one you have by looking at the TTL on the first NXDOMAIN reply.
### 2.5 Clock 3: the failure cache
When a resolver gets no usable answer, RFC 9520 requires it to remember that, for at least 1 second and at most 5 minutes [10]S. RFC 2308 allows SERVFAIL to be cached too, with the same 5 minute ceilingS. The point is to stop a resolver from hammering a server that is down. RFC 9520 cites.COM and.NET query rates rising from about 7,000 to 900,000 per second during the October 2021 Facebook outage, which are the RFC’s numbersS.
Documented defaults are short: 5 seconds for SERVFAIL in the CoreDNS cache plugin and 60 seconds for the PowerDNS packet cacheS. We measured none of this. Our authoritative outage test (next section) showed what a client sees, not how often a resolver retries, and retry volume was not measured. For your own resolver’s failure cache, take the number yourself.
### 2.6 Clock 4: the stale window
Serve-stale is the one clock that makes an outage shorter instead of longer. Without it, both resolvers stopped answering when the 5 second TTL ran out and the authoritative was unreachable: the last success was at about 5.0 s in Unbound and 4.0 s in BINDM. With serve-stale configured for a 15 second window, Unbound kept answering until about 20 s after the cache fill, which is the 5 s TTL plus 15 s of windowM. BIND’s last success was at about 19.0 sM.
| Authoritative unreachable from t = 0 | Last success | Failure from | Stale reply TTL |
| --- | --- | --- | --- |
| Unbound, default | 5.0 s | 6.0 s | none served |
| Unbound, window 15 s | 20.1 s | 21.1 s | 30 s |
| BIND, default | 4.0 s | 5.0 s | none served |
| BIND, window 15 s | 19.1 s | 5.0 s, intermittent | 30 s |
_Table 2.2. Serve-stale in our lab, 5 second record, authoritative made unreachable, stale window 15 s. Last success is seconds after the authoritative stopped answering, which is about the moment of the cache fillM._
Two limits apply. First, BIND answered only 11 polls and failed 2, and its first failure appeared at 5.0 s, so its answers were intermittent in the window, not continuous. Say “last success”, not “continuous service” (the poll pattern was not examined further)M. Second, we tested one outage mode. We did not compare an unreachable server with a REFUSED one, we did not measure retry volume, and the lag between the authoritative coming back and the resolver recovering is not citable from this run.
The stale reply TTL matched Unbound’s documented `serve-expired-reply-ttl` default of 30 s [14]S. BIND also returned 30 sM, which we report as a measurement only: We did not read the BIND option text that would say whether that is a default.
Serve-stale has a cost. RFC 8767 notes that it can extend the time an attacker’s forged data stays reachable, and that it has DNSSEC implications [11]S. A long stale window is also a second delay on top of your TTL when you want clients to see a change, and it is the resolver owner’s decision.
### 2.7 Clock 5: parent or child
A delegation exists twice: as NS records in the parent zone and as NS records in your own zone. They have separate TTLs, and a resolver chooses one. RFC 9199 section 3.6.2 says resolvers may use the parent TTL and that operators should keep old infrastructure running for the larger of the parent and child TTLs [13]S. It also advises that address records of in-bailiwick name servers carry a TTL no longer than the NS TTLS. Moura et al. found most resolvers child-centric and some parent-centric, in 2019 data from the open internetS.
We tested the two resolvers we had. The lab was three tiers (a root, a parent and a child, all custom scriptable servers), the resolver started from root hints, and we polled once a second with fresh names after moving the delegation at the parent to a new server. Unbound kept the old server for about the child NS TTL: 30.2 s with a parent TTL of 6 s and a child TTL of 30 s, and 6.0 s with the values swappedM. BIND switched after about the parent NS TTL: 5.1 s with parent 6 s and child 30 s, and 29.1 s with the values swappedM.
| NS TTL (parent, child) | Unbound 1.22.0 | BIND 9.20.30 | Child expects | Parent expects |
| --- | --- | --- | --- | --- |
| 6 s, 30 s | 30.2 s | 5.1 s | 29 s | 5 s |
| 30 s, 6 s | 6.0 s | 29.1 s | 5 s | 29 s |
_Table 2.3. Seconds until the resolver used the new delegation after a parent change. Unbound followed the child NS TTL, BIND the parent NS TTLM._
The conclusion is as narrow as the lab. Two resolvers, two TTL pairs, a synthetic three tier setup, no real TLD servers. In our lab they differed, and that is enough for the advice: when you move a zone between providers, wait for the larger of the parent and child NS TTLs before you switch off the old servers, and do not assume your resolvers all follow the same oneO.
### 2.8 A worked example: why you lower the TTL early
The clocks add up, and the simplest sum is one you can do yourself. You have a record with a 20 second TTL and you want to move it. Suppose you lower the TTL to 2 seconds and change the address at once. The resolver already holds a copy that expires up to 20 seconds from when it fetched it, and a new, shorter TTL on the authoritative does nothing to that copy.
We measured exactly this, with an old TTL of 20 s and a new TTL of 2 s. With no TTL change, the stale window was about 19.7 s in Unbound and 18.1 s in BIND. Lowering the TTL right before the change gave 18.9 s and 17.9 s, which barely helped. Lowering the TTL a full old TTL ahead cut the window to about 2.3 s in Unbound and 0.9 s in BINDM. In the ahead case the lab waited out the old entry and made one query first, so that row confirms the arithmetic and does not test resolver behaviour. All six cases were inside tolerance of what the arithmetic predicts.
| Moment the TTL is lowered | Unbound | BIND |
| --- | --- | --- |
| Never (baseline) | 19.7 s | 18.1 s |
| At the moment of the change | 18.9 s | 17.9 s |
| One old TTL ahead | 2.3 s | 0.9 s |
_Table 2.4. Seconds the old answer stayed visible, old TTL 20 s, new TTL 2 sM._
The same arithmetic shows up when the TTL is left alone. After the authoritative answer changed, each resolver kept serving the old address for about the remaining TTL. Measured minus expected stayed within 0.95 s for Unbound and within 0.72 s for BIND across TTLs of 3, 6 and 12 s flipped at 10, 50 and 90 percent of the TTL, and a TTL of 0 was not reused at allM. In our lab Unbound ran 0.4 to 1 s later than the arithmetic and BIND equal or slightly earlier. We did not investigate whyM. RFC 1034 section 3.6 already advises lowering the TTL before an anticipated change [4]S. The lab says how far ahead: a full old TTL.
That is the cache term only. The health check, the change reaching the authoritative and the client caches are not in this lab, so a real cutover is longer than anything in this chapter. Chapter 5 adds them.
### 2.9 What this chapter did not measure
We ran two resolvers. A TTL grid beyond 5 and 20 s, TTL 0 in the clamp test, NODATA and SERVFAIL negative caching, retry volume, REFUSED outages and the DS cache were not run. All timings come from one laptop with emulated CPUs and a custom authoritative. They are lower bounds. Two full runs agreed on all 91 cases, with a maximum difference of 0.86 s [8]M.
> **Do this week**
>
> List the resolvers your clients actually reach: the one in your VPC, the one in the node image, the public one a laptop uses. For each, write its floor, its positive cap, its negative cap and its stale setting. Where you cannot find a value, query a record you control with a 5 second TTL and watch the TTL in the reply count down.
## Chapter 3: Negative caching and the record that does not exist yet
**Why is a record you just created still NXDOMAIN for some users?**
_In the model of chapter 2: the negative clock, the one most operators never set on purpose._
You deploy a service, ask a colleague to open its new hostname, and it fails. You create the record a moment later and it still fails. Nothing is wrong with the record. The resolver asked once, got an answer that said the name does not exist, and kept that answer.
### 3.1 What is cached, and for how long
RFC 2308 says an NXDOMAIN answer is cached by name and class, and a NODATA answer (the name exists, the type does not) by name, type and class [9]S. So a failed lookup for `new.example.org` hides the name, and a failed AAAA lookup for an existing name hides only the AAAA. RFC 2308 section 8 makes negative caching mandatory for caching resolvers S.
The duration comes from the zone’s SOA record, not from any record you created. RFC 2308 section 5 sets the negative TTL from the lower of the SOA MINIMUM field and the TTL of the SOA record itself [9]S. It suggests capping negative caching at 1 to 3 hours and says values over one day have been found to be problematicS. Most zones carry whatever SOA the provider’s template wrote, and few operators have looked at its last field. The resolver may add its own bounds on top, which chapter 2 listed.

_Figure 3.1. A name queried before it exists is invisible until the negative entry expires. The zone gets the record at step 3, but the client at step 4 is answered from the resolver’s cache. Numbers are those of the lab case in the table below._
### 3.2 What we measured
We tested the rule on Unbound 1.22.0 and BIND 9.20.30 in a Docker lab with one internal network and a scriptable authoritative server we wrote for the experiments. The lab ran on one laptop, with the image CPU emulated on an arm64 host, so allow a few hundred milliseconds of overhead. Each case created the name right after the first NXDOMAIN and timed how long the resolver kept hiding it. A case counts as a match when the measured time is within −1.2 s to +1.5 s of min(SOA TTL, SOA MINIMUM), or of the resolver cap where one was set. The harness ran twice and the two runs gave the same verdicts.
The authoritative has two reply modes. In `capped` mode it lowers the SOA TTL in the authority section to min(SOA TTL, MINIMUM) before sending, which is what RFC 2308 section 5 expects of the responding server. In `uncapped` mode it sends the zone’s SOA TTL unchanged. The first round used `uncapped` mode, which we had not intended, and the second round added `capped` mode. This matters below. In `capped` mode the lab server had already applied the minimum, so those rows show that the resolvers honor the wire TTL, not that they compute the minimum.
| Resolver | SOA TTL / MIN | Reply mode | Reply TTL | Expected | Measured | Match |
| --- | --- | --- | --- | --- | --- | --- |
| Unbound | 8 / 8 | capped | 8 | 8 | 8.6 | yes |
| Unbound | 30 / 6 | capped | 6 | 6 | 6.9 | yes |
| Unbound | 30 / 6 | uncapped | 6 | 6 | 6.9 | yes |
| Unbound | 60 / 6 | uncapped | 6 | 6 | 6.95 | yes |
| Unbound | 20 / 20, cap 3 s | capped | 3 | 3 | 3.6 | yes |
| BIND | 8 / 8 | capped | 8 | 8 | 7.8 | yes |
| BIND | 30 / 6 | capped | 6 | 6 | 5.9 | yes |
| BIND | 30 / 6 | uncapped | 30 | 6 | 29.9 | no |
| BIND | 60 / 6 | uncapped | 60 | 6 | 59.9 | no |
| BIND | 20 / 20, cap 3 s | capped | 3 | 3 | 2.3 | yes |
_Table 3.1. Seconds a created name stayed invisible, run 2 of 2. Lab-mode: the authoritative is our own scriptable server. 8 of 10 cases match. The cap is `cache-max-negative-ttl 3` for Unbound and `max-ncache-ttl 3` for BIND._
Behind a compliant reply the two resolvers agree. With SOA TTL 30 s and MINIMUM 6 s, BIND hid the name for about 5.9 s and Unbound for about 6.9 s, and both reported a first reply TTL of 6M. With TTL and MINIMUM both 8 s, Unbound took 8.6 s and BIND 7.8 sM. The one-second spread is inside the tolerance and is mostly whole-second TTL counting plus lab overhead. A configured negative cap won over the SOA in both: a 20 s negative answer was cut to about 3.6 s in Unbound and 2.3 s in BINDM. In our lab, then, a name created right after a failed lookup stayed invisible for roughly the negative TTLM. Every case created the name right after the first NXDOMAIN. We did not run a control that creates the name before the first lookup, so the lab shows the hidden window, not its absence.
#### 3.2.1 The two rows that missed, and what they do not show
An earlier round of this experiment found BIND hiding the name for about 30 s where Unbound took about 6 s. That round used the lab authoritative in `uncapped` mode, which we had not intended. The first BIND result was a lab artifact: with a compliant reply, BIND gave 5.9 s, the same as Unbound.
The two rows that remain are the uncapped ones. When the lab authoritative sent an authority SOA with TTL 30 (or 60) and a MINIMUM of 6, a reply a compliant authoritative would not send, BIND 9.20.30 cached the NXDOMAIN for about 29.9 s (about 59.9 s), while Unbound 1.22.0 cached it for about 6.9 sM. The measurements are the same in both runs (29.84 and 29.869 s, 60.01 and 59.904 s). Read this as lab-mode behavior: it is what each resolver did when handed a reply that the lab authoritative built that way. It is not evidence that BIND ignores the SOA MINIMUM, it is not a BIND defect, and it does not contradict RFC 2308.
We looked for an explanation in the BIND manual. The text for `max-ncache-ttl` and `min-ncache-ttl` in the 9.20.0 reference manual, which we read for this paper, does not say how the negative TTL is derived from the SOA recordS. That is a statement about those two option texts, not about the whole manual or the source code, and the lab ran 9.20.30 while the page is the 9.20.0 manual of the same stable branch. The manual gives `max-ncache-ttl` a default of 10800 s (3 hours), with a ceiling of 7 days, and `min-ncache-ttl` a default of 0 s with a ceiling of 90 s [19]S. A 10800 s cap is far above 30 s, so it does not explain the 29.9 s result.
> **Common trap**
>
> Two resolvers can derive different negative TTLs from the same reply, as BIND and Unbound did when the wire SOA TTL was left unloweredM. Choose both the SOA TTL and the MINIMUM on purposeO.
### 3.3 A worked example
Take a zone with SOA TTL 3600 s and MINIMUM 300 s. By RFC 2308 the negative TTL is min(3600, 300) = 300 sD. A client resolves `api-2.example.org` at 12:00:00, before you create the record, and gets NXDOMAIN. You create the record at 12:00:10. Any resolver that behaves as RFC 2308 describes keeps the NXDOMAIN until 12:05:00, so that client’s resolver hides your new record for 4 minutes 50 seconds, and every other client behind the same resolver shares the entryD. Raise MINIMUM to 3600 and the window is nearly an hour. Lower it to 30 and it is 20 seconds. The cost of a low MINIMUM is more authoritative queries for names that do not exist, and we did not measure that cost.
A negative cap in the resolver is a second dial, and it is the resolver operator’s, not yours. With the cap at 3 s, both resolvers we ran hid a 20 s negative answer for about 3 s (3.6 s in Unbound, 2.3 s in BIND). If your users sit behind a resolver you do not run, assume the SOA is the only dial you hold.
### 3.4 Other places the same answer appears
Failures: RFC 2308 allows caching SERVFAIL for at most 5 minutes, and RFC 9520 repeats the 1 second to 5 minute bounds for resolution failures [10]S. We did not run a SERVFAIL case, so we cannot say how either resolver behaves inside that window.
Runtimes: the Java SE 21 documentation says unsuccessful lookups are cached for 10 seconds by default through `networkaddress.cache.negative.ttl`, and that a value of −1 means forever [1]S. That is a second negative cache stacked on the resolver’s, inside the application. Our Java runs in chapter 6 did not change this setting, so the 10 s figure is the documentation’s, not a measurement.
Small resolvers: the dnsmasq manual says `--neg-ttl` is used only when the reply carries no SOA [17]S. On a normal reply, the SOA you publish still decides. We did not run dnsmasq.
A real case: Slack’s account of its September 2021 DNSSEC rollout says Route 53 signed an NSEC record for a wildcard that omitted type information. Some resolvers then cached “no records of any type”, and A lookups for under 1 percent of users failed for about 24 hours [20]S. We report it as Slack’s account. We did not reproduce it, and our lab ran no NODATA, wildcard or DNSSEC case.
### 3.5 What we did not measure
We did not measure NODATA against NXDOMAIN scope, an AAAA NODATA hiding an A answer, SERVFAIL windows, replies with no SOA, or any resolver other than Unbound 1.22.0 and BIND 9.20.30. We did not run the Java negative cache setting. The lab authoritative is a custom server, so every claim about what an authoritative sends is lab-mode.
> **Prove it**
>
> Run `dig SOA yourzone`. Read the TTL and the last field (MINIMUM) of the answer, write down min of the two, and compare it with how long you are willing to wait for a new name to appear. Then check which resolvers your clients use and write each one’s negative cap next to it.
> **Key takeaways**
>
> - A failed lookup is cached, and both resolvers cached it for the TTL the authoritative put on the wire, which a compliant server sets to the lower of the SOA TTL and MINIMUM. A name you create right after a miss stays hidden for about that long.
> - In our lab both resolvers gave 5.9 s and 6.9 s behind a compliant reply with SOA TTL 30 s and MINIMUM 6 s. The earlier 30 s from BIND came from our lab authoritative, and the remaining difference is lab-mode behavior, not a verdict on BIND.
> - Query before you create. If a name might have been looked up already, plan for the negative window, and set the SOA TTL and the MINIMUM on purpose, then read the TTL on the first NXDOMAIN reply from your own resolver.
## Chapter 4: When the authoritative servers vanish
**What does a resolver do when it cannot reach your servers, and what does that do to you?**
On 4 October 2021 Meta’s authoritative DNS servers withdrew their own BGP advertisements when they could not reach the data centers, and so “became unreachable even though they were still operational” [21]S. The servers were healthy. Nobody could ask them anything. Meta also reports that the loss of DNS broke internal toolsS.
For a resolver, a dead authoritative and a withdrawn route look the same: no answer. What the resolver does next decides whether your users see old data, an error, or a retry storm aimed at the servers you are trying to bring back. This chapter covers the three behaviours, then our measurements of the first two.
### 4.1 Three things a resolver can do
When a refresh gets no reply, a resolver has three options, and most deployments use a mix.
Answer from cache until the TTL runs out. Before expiry nothing is wrong. The authoritative is not asked, so its absence is invisible. This is the only protection a default configuration gives you, and it is as long as the TTL you chose. A 60 second failover TTL buys one minute of grace, a 24 hour TTL buys a day.
Serve the expired answer. RFC 8767 lets a resolver return an expired record when it cannot get a fresh one [11]S. It requires the stale TTL on the reply to be above zero and recommends 30 seconds. It suggests a client response timer of 1.8 seconds, so the client does not wait out a full resolution attempt before getting the stale answer. It suggests keeping stale data for 1 to 3 days at most, and says a failed refresh should not be retried more often than every 30 secondsS. We call the period after expiry the stale window.
Remember the failure and retry. RFC 9520 requires resolvers to cache resolution failures for at least 1 second and at most 5 minutes, and says they should back off [10]S. The reason is load. The RFC cites query rates for.COM and.NET rising from about 7,000 to 900,000 per second during the October 2021 Facebook outage, and a 2021 test by Verisign with roughly 50 to 60,000 queries per second for one domain [10]S. These are the RFC’s figures, not Meta’s. Meta’s own post says nothing about query load.

_Figure 4.1. One record through an authoritative outage. With serve-stale off the resolver fails as soon as the TTL runs out. With it on, the same record survives for the TTL plus the configured window. Times are the ones we measured with a 5 second TTL and a 15 second window._
### 4.2 The cost of stale
Serving stale is not free, and the RFC says so. Section 10 of RFC 8767 notes that serving stale data can extend the time an attacker’s forged data stays reachable, and that it has DNSSEC implicationsS. The second point matters most for your own records: if a stale answer is wrong, or a signature on it has lapsed, the resolver may keep handing it out for the whole window. A long window is a longer exposure to whatever was true when the record was last fresh.
The documented defaults differ widely. The table below sets the RFC values beside what each resolver’s documentation says and what we measured. Documented values are from pages read on 2026-11-11, and not all of every page was read.
| Item | RFC 8767S | UnboundS | MeasuredM |
| --- | --- | --- | --- |
| Serve-stale default | n/a | `serve-expired` is `no` | Off in both resolvers we ran |
| Reply TTL when stale | Above 0, 30 s suggested | `serve-expired-reply-ttl` 30 s | 30 s in Unbound and in BIND |
| Stale window | 1 to 3 days at most | `serve-expired-ttl` default 86400 s | Set to 15 s in the lab |
| Client timer | 1.8 s suggested | `serve-expired-client-timeout` 1800 ms | Not measured |
CoreDNS documents `serve_stale` with a default of 1 hour and says stale responses carry TTL 0 [16]S. That differs from the RFC’s requirement of a stale TTL above zero, and we did not run CoreDNS, so we cannot say what a deployed CoreDNS does. For BIND we confirmed only that the option names exist (`stale-answer-enable`, `stale-cache-enable`, `max-stale-ttl`, `stale-refresh-time`, `stale-answer-client-timeout`) [18]S. We did not read the 9.20 stale option text, so no BIND stale default is printed. For PowerDNS Recursor and for Unbound’s serve-expired options beyond those in the table, we did not read the relevant manual text, so we make no claim.
### 4.3 What we measured
> **Method and limits**
>
> Experiment E3 ran on one laptop under Docker 29.8.2 (linux/amd64 images emulated on arm64), with Unbound 1.22.0 and BIND 9.20.30 as the resolvers and a scriptable authoritative on an isolated network [8]. The record had a TTL of 5 seconds. After one lookup filled the cache, the authoritative dropped every query for 26 seconds (a silent outage, one failure mode only), and a probe asked the resolver once a second and logged every reply. Each configuration ran once per suite and the suite ran twice, so the figures below are single runs. The probe waited at most 6 seconds for a reply, so the 6 second failure latencies we saw are the probe’s timeout, not a resolver timer. We did not test REFUSED, did not count queries sent to the authoritative, and did not measure how long a resolver takes to recover when the authoritative returns, because the recovery replies differed between runs and the harness does not establish a lag. Both resolvers ran with a 5 second TTL and a 15 second stale window, which is far shorter than any production value.
| Resolver | Config | Last ok | First fail | Ok / fail | Stale TTL |
| --- | --- | --- | --- | --- | --- |
| Unbound | Default | 5.02 s | 6.02 s | 6 / 10 | none served |
| Unbound | `serve-expired yes`, 15 s window | 20.06 s | 21.06 s | 21 / 1 | 30 s |
| BIND | Default | 4.03 s | 5.04 s | 5 / 6 | none served |
| BIND | `stale-answer-enable`, `stale-cache-enable`, `max-stale-ttl` 15 s | 19.05 s | 5.02 s | 11 / 2 | 30 s |
Times are seconds after the authoritative stopped answering, which is about the moment of the cache fill, from the later of two runsM. The earlier run gave 5.0 s, 20.03 s, 4.0 s and 19.02 s for last success, the same poll counts for the two serve-stale rows and one fewer failed poll for Unbound at default, so the pattern heldM. Both defaults stopped answering when the 5 second TTL ran out. Unbound’s last success was at 5.02 s and BIND’s at 4.03 s, a second earlier, which fits a TTL counted in whole seconds letting a cache drop an entry up to a second earlyM. Neither served a stale record.
Unbound with serve-expired kept answering until 20.06 s. That is the 5 second TTL plus the 15 second window, and the match is the whole result: the configured window is the extension you getM. The poll log had 21 successes and one failure. The stale replies carried a TTL of 30 seconds, which equals the documented `serve-expired-reply-ttl` default [14]M.
BIND needs a more careful reading. With serve-stale enabled its last success was at 19.05 s, close to the same 20 seconds. But its first failure came at 5.02 s, the moment the TTL ended, so the log shows 11 successes and 2 failures in the window, not a clean run of answersM. The answers were intermittent. We did not examine why, and we do not claim it is a fault: it may be how BIND balances refresh attempts against the stale answer, but we did not test that. What the figures support is narrower. A BIND with serve-stale on can still hand a client a failure inside the window, so do not size anything on the assumption of continuous serviceM. Its stale replies carried a TTL of 30 seconds. We did not find a BIND default that documents that value, so it is a measurement onlyM.
#### 4.3.1 The lab settings
Only the lines that differ from the lab’s base resolver configuration (Appendix A) are listed. These are the exact settings, and a 15 second window is a test value, not advice.
```yaml
# Unbound 1.22.0
serve-expired: yes
serve-expired-ttl: 15
```
```text
# BIND 9.20.30 options
stale-answer-enable yes;
stale-cache-enable yes;
max-stale-ttl 15;
```
#### 4.3.2 Worked example: how long does one record survive?
Take a record with a 300 second TTL, a resolver whose stale window is 3600 seconds, and an authoritative that goes dark 100 seconds after a cache fill. The cached copy has 200 seconds left, so clients see fresh data until second 300 of its life. From then the resolver serves stale for up to 3600 seconds more. The last stale answer goes out at 300 + 3600 = 3900 seconds after the fill, that is 3800 seconds after the outage began, a little over an hourD. This follows the pattern in our measurement (5 + 15 = 20), scaled up. We did not run these numbers. Add the caveat from the BIND log: where a resolver is intermittent, some clients see failures well before 3900 seconds.
The same arithmetic shows why a short TTL is a smaller buffer than it looks. With the default off, a 60 second TTL gives at most one minute of survival, and a cache that filled 50 seconds earlier has 10 seconds left. Serve-stale is the setting that turns that into hours, and it is off by default in the Unbound manual we readS.
### 4.4 Incidents: what DNS tails do and do not show
The Meta outage is the clean case of this chapter: authoritative servers that are up but unreachable [21]S. The post gives no TTL or cache figures, so it cannot tell you how long caches covered the gap.
On 14 July 2025, Cloudflare’s 1.1.1.1 resolver service was down for 62 minutes, from 21:52 to 22:54 UTC. A configuration change made on 2025-06-06 stayed dormant until a refresh on 2025-07-14 withdrew the resolver’s prefixes. DNS over HTTPS on a separate hostname and addresses was largely unaffected, and client retries produced a spike after the fix [22]S. The post does not say anything about caching or stale answers, and we draw no inference about them.
AWS’s summary of the October 2025 DynamoDB disruption gives a timeline in Pacific time. DNS failures began at 11:48 PM on 19 October. AWS says DNS information was restored at 2:25 AM, that cached DNS records expired between 2:25 and 2:40 AM, and that DynamoDB recovered at 2:40 AM [2]S. The summary does not split that tail into resolver caches and client reconnects, and we do not either. It is one statement of one source. What it does show is that after the cause was repaired, caches held the old state for up to about 15 minutesS.
The three incidents are different failures: unreachable authoritative servers at Meta, an unreachable public resolver at Cloudflare, and a regional endpoint with no addresses at AWS. None of the three posts turns its DNS caching into TTL guidance. We read four incident reports for this paper (AWS, Meta, Cloudflare and Slack) and none gave oneS.
### 4.5 What public resolver documents say
If your users sit behind a large public resolver, you have no control over its stale policy and little documentation of it. The Cloudflare 1.1.1.1 FAQ states that it validates DNSSEC, sends no EDNS Client Subnet and has a cache purge tool, and says nothing on TTLs, negative caching or serve-stale [23]S. The Google Public DNS introduction, read the same day, carries no TTL or serve-stale detail either [24]S. Its performance page says only that zero-TTL answers and errors are not cachedS. We make no claim about what either service does. The only public figure we found for a Google cap is Slack’s observation of a 6 hour cap on one DS record, which is Slack’s observation about one record and not a documented clampS.
### 4.6 What to do
> **Common trap**
>
> Turning serve-stale on and calling it a failover plan. It extends the life of the answer you already published. It does not move users to a new address. If your design is to point the record at a standby, a stale answer for the dead address is exactly what you do not want during the windowO.
For records that are stable, a long stale window is cheap insurance against an authoritative outageO. For records you rely on to move traffic, keep the window short or off, and say so in the runbook. RFC 8767′s own risk text, extended attack window and DNSSEC effects, is the reason not to set the window to its maximum by habitS.
#### 4.6.1 Reading the drill
Read each possible result of that five minute test as follows. The reading is our judgement, not a measured ruleO.
| What the probe shows | What it means |
| --- | --- |
| Failures start when the TTL ends | Serve-stale is off. Your outage tolerance is the TTL you published, no more. |
| Answers continue past the TTL, then stop | Serve-stale is on. The last answer time minus the TTL is the window you actually have. Compare it with the value you configured. |
| Answers continue, with failures mixed in | The resolver is serving stale intermittently. Count the failures and plan for that share of clients, as with the BIND log above. |
| Answers never stop | The window is longer than your drill. Check the setting before you trust it with a record you need to move. |
#### 4.6.2 Prove it
Pause your authoritative in staging, or drop its traffic, for five minutes. Ask your own resolver for one cached record once a second from a probe, and write down three numbers: the last time the old TTL answered, the last time any answer came, and how many failures appeared in between. Compare them with the 5.02 s, 20.06 s and one failure we measured for Unbound.
> **Key takeaways**
>
> - With serve-stale off, an authoritative outage reaches users the moment the TTL runs out. We measured 5.02 s for a 5 second TTL in Unbound.
> - With serve-stale on, the record survived for the TTL plus the configured window (20.06 s for 5 s plus 15 s). BIND answered intermittently inside its window.
> - The incident record gives caches no credit and no blame: no source we read turns its DNS caching into TTL guidance.
## Chapter 5: Failover by DNS: the arithmetic of cutover
**From the moment a primary dies, how long until users reach the secondary, and which terms of that sum can you shorten?**
Two provider documents describe health-checked DNS failover and neither prints the total. Microsoft’s page on Traffic Manager works through a timeline with a 30 second probe interval, 3 tolerated failures, a 10 second timeout and a 30 second TTL, and marks the endpoint degraded after the fourth consecutive failure [25]S. Amazon’s pages give the Route 53 health check parameters and recommend 60 or 120 second TTLs for failover records [26, 27]S. We read both and found no end-to-end cutover time on either page, and we found no source among the 34 we read that composes the piecesS. You have to add the pieces yourself. This chapter adds them, measures the one term a resolver lab can measure, and says which terms stay arithmetic.
### 5.1 The sum
A cutover is the time from the failure of the primary to the first successful request on the secondary. We split it into five termsD:
`cutover = D + P + K + C + R`
`D` is detection: the time for the health checker to mark the primary down. `P` is propagation: the time for the changed answer to reach the authoritative servers that answer clients. `K` is the resolver cache term: the time a resolver keeps serving the old answer after the authoritative changed. `C` is client cache: anything the application or runtime keeps on top of the resolver. `R` is connection reuse: a client with an open connection to the dead address never asks DNS again (chapter 6).
Only `K` can be measured in a resolver lab, and it is the only term we measured. The rest is derived from documentation or left open, and each is labeled so below.
#### 5.1.1 Detection, worked
Let `I` be the probe interval, `F` the number of consecutive failed probes needed to mark the endpoint down, and `T` the time a failing probe takes to fail (its timeout). Traffic Manager’s documented timeline marks the endpoint degraded after the fourth consecutive failure with 3 tolerated failures, so `F` is the tolerated failures plus one [25]S. Assume probes start every `I` seconds and the failing ones each wait out the full timeout. The first failing probe starts between 0 and `I` after the failure. The fourth starts `3 I` after the first. It fails `T` later. That givesD:
`D_min = (F - 1) I + T` `D_max = F I + T`
For the documented example, `I` = 30 s, `F` = 4, `T` = 10 s, so `D` is between 100 and 130 seconds. This is our arithmetic from the documented parameters under the assumptions above. Microsoft does not print that number on the page we readS. Route 53 adds a wrinkle: an endpoint counts as healthy when more than 18 percent of the checkers in many locations report it healthy, and an HTTP check needs a TCP connect within 4 seconds and a response within 2 seconds [26]S. We did not model the checker quorum, so for Route 53 treat `D_max` as a starting estimate and read the provider’s own timing for your configuration.
#### 5.1.2 Cache, then the rest
If a resolver cached the old answer at time `t_fill` and the authoritative changes at `t_change`, the resolver keeps the old answer until it expires. Chapter 2 gives the clamps and caps that can alter the TTL it honors. With the TTL honored as writtenD:
`K = TTL - (t_change - t_fill)`, floored at 0
The next section measures that rule. A resolver that filled just before the change contributes nearly the whole TTL. One that filled a TTL ago contributes nothing. Across many resolvers and many users all phases occur, so a published TTL is a worst case for `K`, and if cache fill times are spread evenly the typical case is about half of itD.
Table 5.1 applies both formulas to three configurations. Row A is the documented Traffic Manager example. Rows B and C are hypothetical settings we chose to show the spread. They do not describe any product’s defaults.
| Row | Settings (`I`, `F`, `T`, TTL) | `D` range | `K` max | `D + K` range |
| --- | --- | --- | --- | --- |
| A | 30 s, 4, 10 s, 30 s (Azure) | 100 to 130 s | 30 s | 100 to 160 s |
| B | 10 s, 3, 5 s, 60 s (made up) | 25 to 35 s | 60 s | 25 to 95 s |
| C | 30 s, 3, 10 s, 300 s (made up) | 70 to 100 s | 300 s | 70 to 400 s |
_Table 5.1. Derived (D), not measured. The lower end of `D + K` assumes the cache expired on its own just before the change. `P`, `C` and `R` come on top of every row._
The sum has not been validated end to end. Our lab had no health checker, no client cache and no connection reuse, so the real cutover is the table’s number plus terms we did not measureD. We treat the table as a lower bound. Figure 5.1 marks the dominant term in each row.
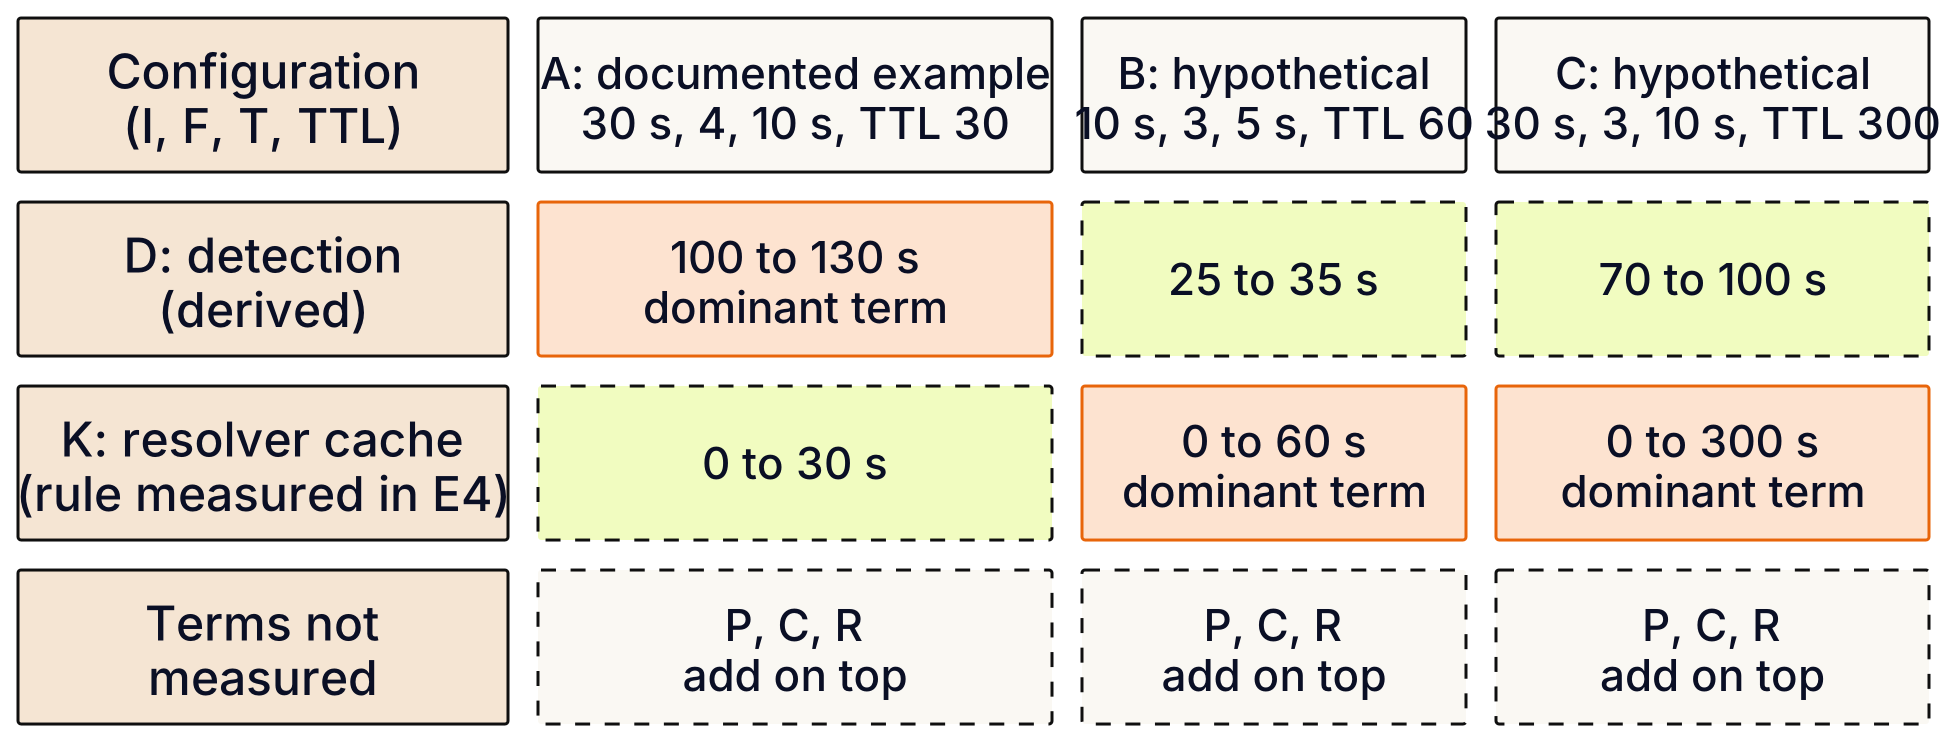
_Figure 5.1. The dominant term moves with your settings. In configuration A detection is most of the wait, in C the TTL is, so a faster probe in C barely moves the total._
A TTL of 300 seconds in row C means a faster health check buys little: cutting `I` from 30 s to 10 s there saves about 40 to 60 seconds out of up to 400D. In row A the reverse holds: detection is the larger term and the probe is the larger lever. Check both terms before you tune one.
### 5.2 What we measured: the cache term
Experiment E4 tests the `K` rule. We filled a resolver’s cache with a record, flipped the record at the authoritative at 10, 50 or 90 percent of the TTL after the fill, and polled the resolver every 0.1 seconds until it returned the new address. Expected cutover was the TTL minus the actual time since the fill. We ran Unbound 1.22.0 and BIND 9.20.30 against a scriptable authoritative server we wrote for the lab, with TTLs of 3, 6 and 12 seconds plus a TTL 0 control, 20 cases in all [8]M. The harness tolerance was minus 1.2 to plus 1.5 seconds around the expected value.
All 20 cases landed inside the tolerance. The largest gap was 0.95 s late for Unbound and 0.72 s early for BINDM. A TTL 0 record was not reused: the new answer appeared after 0.001 s in Unbound and 0.007 s in BINDM. Both runs of the whole suite agreed on every verdictM. The TTL 12 rows show the rule at three phases:
| Flip after fill | Expected | Unbound 1.22.0 | BIND 9.20.30 |
| --- | --- | --- | --- |
| 1.2 s (10%) | 10.8 s | 11.59 s | 10.08 s |
| 6.0 s (50%) | 6.0 s | 6.80 s | 5.34 s |
| 10.8 s (90%) | 1.2 s | 1.75 s | 1.14 s |
_Table 5.2. E4, record TTL 12 s. Seconds from the authoritative change until the resolver returned the new address, later of two runsM._
The cutover shrinks the later the flip lands in the TTL. That is all `K` is: a countdown that began when some resolver last asked, not when you changed the record. Unbound ran 0.4 to 0.95 s above the arithmetic in every non-zero case and BIND ran equal or up to 0.7 s below. We do not know why. The probe step, whole-second TTL counting and emulated CPU are candidates, and we tested none, so we make no claim about either resolver’s behavior from that offsetM.
> **What E4 does not show**
>
> The flip was made at the authoritative directly, so `P` was near zero by construction. Polling was at the resolver, so no client cache and no connection entered the measurement. No health checker ran, so `D` was never measured. TTLs were 3, 6 and 12 seconds, not the 60 to 300 seconds of production failover records, and we ran two resolvers on one emulated laptop lab. Beyond 12 seconds, Table 5.1 extends the rule by arithmetic, not by measurement. Real cutovers through shared resolver farms, anycast and middleboxes will be longer.
### 5.3 The window before the change: lowering the TTL
The `K` rule has a consequence for planned changes. If `K` is a countdown from the last fill, a TTL you lower today cannot shorten a cache entry that was filled yesterday under the old value. Experiment E5 tests this with an old TTL of 20 seconds and a new TTL of 2 seconds. In three modes we measured the stale window, the time from the record change until the resolver returned the new address [8]M:
| Mode | Unbound 1.22.0 | BIND 9.20.30 |
| --- | --- | --- |
| Baseline: TTL stays 20 s | 19.7 s | 18.1 s |
| Lowered to 2 s about 1 s before the change | 18.9 s | 17.9 s |
| Lowered to 2 s about 22 s before the change | 2.3 s | 0.9 s |
_Table 5.3. E5, stale window by when the TTL was lowered. Old TTL 20 s, new TTL 2 s, later of two runsM._
Lowering the TTL right before the change did almost nothing, since the resolver already held a 20 second entry. Lowering it one old TTL ahead, in our case 22 seconds before a 20 second entry, cut the window to about 2 seconds for Unbound and under 1 second for BINDM. All six cases were within the harness tolerance. The “ahead” run waited out the old entry and then made one query so that the resolver had refilled with the 2 second record before the change. A quiet cache refills only when someone asks, and in production someone usually doesO. The limit is again one old TTL and two resolvers, with one TTL pairM.
The rule for a planned change is the same as the rule for `K`. Lower the TTL at least one old TTL before the change, change, and raise it again afterO. A zone with a one day TTL needs the lowering a day earlier. A failover record that must be switchable on demand should carry a short TTL permanently, because the change you have to make in an emergency is the one nobody lowered a TTL for.
### 5.4 When the second address is the fallback
A record set with two addresses moves part of the work to the client. In E7 the first address was dead and the second alive. Python, Go (both resolver modes) and curl reached the second address within about a quarter of a second when the first refused the connection. A blackholed first address cost one connect timeout or more, and the Java API we ran (OpenJDK 21.0.13, `HttpURLConnection`) did not use the second address in either case, which is a finding for one JDK build and one API, not for Java in generalM. Chapter 6 has the table. Two addresses helped Python, Go and curl when the failure was a refusal, and helped much less when the failure was silence. We did not compare two addresses against a short TTL, so we do not rank themO.
### 5.5 Two ways the health check makes it worse
If every endpoint is unhealthy the check has nothing to offer. Route 53 documents that when all records are unhealthy it treats all of them as healthy rather than return no answer [28]S. Traffic Manager documents that when all endpoints are degraded the service responds as if all were online [25]S. Both choices keep some answer flowing, and neither can fix a failure of the last good endpoint. Our lab did not implement either behavior, so we did not test them.
Detection is software and it fails too. In the AWS summary for 19 to 20 October 2025, Network Load Balancer health checks flapped and automatic availability-zone failover removed capacity. AWS disabled that failover at 9:36 AM and re-enabled it at 2:09 PM, and the event ran until 2:20 PM on 20 October [2]S. A health-checked failover path is a control loop and it can act on a bad signal, so bound how much capacity it may removeO. Chapter 8 tells the DNS automation side of that event.
### 5.6 A decision table
| Situation | What bounds the switch | Do this |
| --- | --- | --- |
| Planned change, you choose the time | `K` of the old TTL (E5: 18 to 20 s of a 20 s TTL when lowered late)M | Lower the TTL at least one old TTL ahead, verify, change, restore. |
| Planned change, TTL already short | The short TTL, plus client caches (chapter 6)M | Change at once. Check the clients that hold addresses longer than the TTL. |
| Unplanned failure, health checked | `D + K`, with `P`, `C`, `R` on topD | Compute `D_max + TTL` from your own settings. Write it next to your RTO. |
| Unplanned failure, TTL is long | The TTL (config C: up to 400 s in total, of which the TTL is up to 300 s and detection 70 to 100 s)D | Shorten the TTL before the probe. Faster probes alone barely help. |
| All endpoints unhealthy | The provider fail-open ruleS | Do not count on DNS to hide a total outage. Read the documented behavior. |
| Client keeps its connection | Not DNS at all. Existing connections are not affected by DNS changes [25]S | Close or drain connections on the dead address from the server side. |
| Two addresses, first refuses | About a quarter second for Python, Go, curl. Not for the JDK 21.0.13 API we ranM | Test your own runtime and API before you rely on it. |
| Two addresses, first drops packets | One connect timeout, or longer with none setM | Set an explicit connect timeout. Choose it from the table above. |
_Table 5.4. Pick the row that matches your situation. The right column is opinion (O) built on the tagged left column._
> **Prove it**
>
> Take your own probe interval, failure count, probe timeout and TTL, and compute `D_max + TTL` with the formulas above. Then add your slowest client’s cache and connection lifetime. Write the total next to your RTO. If it is larger than the RTO, change a setting or change the RTO. The derived number is a lower bound, so a measured failover drill (kill the primary in staging and time the first success) will be higher.
> **Key takeaways**
>
> - A DNS cutover is five terms, and the resolver cache term follows `TTL - (t_change - t_fill)` within about a second in our lab, for two resolvers and TTLs up to 12 seconds.
> - Lower the TTL one old TTL before a planned change. Lowering it late changed almost nothing, and lowering it ahead cut a 19 second window to 1 to 2 seconds.
> - Detection, propagation, client caches and connection reuse were not measured here. Compute `D_max + TTL` for your configuration and treat it as a floor.
## Chapter 6: Clients that keep their own clock
**After DNS has switched, which of your own clients still go to the old address, and for how long?**
Chapters 2 to 5 stopped at the resolver, apart from the preview in chapter 1. A record changed at the authoritative server, the resolver’s copy expired, and the next lookup returned the new address. That is the end of the story only for a client that asks the resolver every time it needs an address. Some do not: in this lab, Java with default settings and a long-lived curl process kept their own copy, and a connection that stays open does not need an address again.
Resolution happens at several layers: the library or runtime cache, the process, the connection, and then the resolver you already know. Each layer can hold the old address for its own time, and the ones that cache by their own rules do not read your TTL. RFC 2181 calls a TTL a maximum time to live, not a mandatory one [6]S. A client is free to keep an answer for less, and nothing in a record stops it keeping an answer for more.
We measured one such layer in each of four runtimes: Python, Go, curl and JavaM. We did not measure Node.js, nginx, requests style Python libraries, or any other client. Where this chapter says “clients”, it means those four builds on one lab, and where a conclusion needs more than that, it says so.
### 6.1 The runtime matrix
The setup was small on purpose. One Unbound 1.22.0 resolver with a fixed 2 second TTL sat in front of a lab authoritative server. A client made one request every 0.5 seconds, on a new connection each time. About 3.5 seconds into the run we changed the record to a second address, and we logged the first request that reached itM. Python 3.12.16 (glibc 2.36), Go 1.23.12 (with the pure Go and the cgo resolver), curl 7.88.1 and OpenJDK 21.0.13 ran as Linux amd64 images emulated on an arm64 laptop. We ran the whole suite twice, and the two runs agree within a second or so on every case belowM. Times are seconds after the change.
The result splits the clients into two groups. Python (urllib, glibc `getaddrinfo`), Go in both resolver modes, and a new curl process per request all moved to the new address between 1.76 and 2.45 seconds after the changeM. That is at most the resolver’s 2 second TTL plus one request interval. The spread between 1.76 and 2.45 seconds is where each run landed in the resolver’s refill cycle, not a difference between runtimes (the two runs swapped the order of Python and curl). No client side cache held the old address. For these runtimes the TTL you publish, as clamped by your resolver, is the whole story.
The other group kept the old address on its own clock. OpenJDK 21.0.13 with `HttpURLConnection` and default settings held the old address for about 30 seconds counted from its first lookup, although the record TTL was 2 secondsM. The change came 3.58 seconds after that lookup, so the first request on the new address arrived 26.66 seconds after the change. We expected 26.42 (30 minus 3.58), and the run came within toleranceM. The Java SE 21 documentation does not promise 30 seconds. It says positive lookups are cached forever when a security manager is installed, and otherwise for an implementation dependent period [1]S. So the 30 seconds is what this JDK build did on this setup, not a Java default you can quote.
The cache starts at the client’s lookup, not at your change, so the worst case after a change is the full cache lifetime, which here is 30 seconds if the change lands just after a lookupD. Our run was in the middle of that range, not at its worst.
#### 6.1.1 The Java settings
Java exposes the cache through the `networkaddress.cache.ttl` security property, and the documentation says a value of −1 means forever [1]S. We set it three ways, through a security properties file, and left the rest aloneM.
- `networkaddress.cache.ttl=0`: the client followed the resolver and switched 1.68 s after the change.
- `networkaddress.cache.ttl=5`: the client switched 1.38 s after the change, which is 5 s from its first lookup, as expected.
- `networkaddress.cache.ttl=-1`: the client did not switch to the new address in a 45 second run. The last of 91 requests that went to the old address was 40.47 s after the change, and there were no errors.
The last row needs its limit. It means “did not switch within 45 seconds”, measured on this build. It does not mean the client never re-resolves, and we did not run it longerM. It is consistent with what the documentation says −1 means.
#### 6.1.2 curl is two programs
curl 7.88.1 gives two different answers depending on how you run it. A new process per request has an empty cache every time and switched at 1.76 seconds. One long lived process that sent a request every half second through its own DNS cache kept the old address until 55.66 seconds after the changeM. We expected 56.4 seconds from a 60 second cache minus the 3.6 seconds that had already passed, and the run came within tolerance. The command line tool has no option for that cache lifetime, only libcurl does, so we measured only its defaultM.
The same program can behave like two different clients, depending on whether it lives for one request or for a thousand. A health check that shells out to curl and a service that links libcurl may see the world 55 seconds apart.
| Runtime and build | Setting | New address after a change, record TTL 2 s | First address dead, second alive (two A records) | Dead IPv6, live IPv4 |
| --- | --- | --- | --- | --- |
| Python 3.12.16, urllib, glibc | default, no cache of its own | 2.45 s | Refused: 0.01 s. Blackhole with 3 s timeout: 3.02 s. Blackhole with no timeout: no success in 20 s (harness cap) | Refused 0.01 s. Blackhole 3.02 s with a 3 s timeout, no success in 20 s without. No Happy Eyeballs seen |
| Go 1.23.12, pure and cgo resolver | default | 1.96 s, both modes | Refused: 0.0 s. Blackhole: 2.01 s with 3 s timeout, 15.01 s with none | 0.0 to 0.31 s in all cases |
| curl 7.88.1, new process per request | default | 1.76 s | Refused: 0.22 s. Blackhole: 2.52 s with 3 s timeout, 11.01 s with none (time includes process start) | 0.01 to 0.21 s in all cases |
| curl 7.88.1, one long lived process | default 60 s cache | 55.66 s | Not run | Not run |
| OpenJDK 21.0.13, HttpURLConnection | default (30 s observed) | 26.66 s | Refused: ConnectException at 0.01 s, live address not used. Blackhole: SocketTimeoutException at 3.02 s with 3 s timeout, no success in 20 s without | Connected within 0.02 s, but the live address was listed first, so this shows nothing about fallback |
| OpenJDK 21.0.13 | `cache.ttl=5` | 1.38 s | Not run | Not run |
| OpenJDK 21.0.13 | `cache.ttl=0` | 1.68 s | Not run | Not run |
| OpenJDK 21.0.13 | `cache.ttl=-1` | No switch in 45 s (last old request 40.47 s after the change) | Not run | Not run |
_Table 6.1. Decision table: runtime, setting and measured behaviorM. Lab values from one laptop, one emulated architecture, two runs that agree. Blackhole means all SYNs dropped, refused means an immediate reset, and the 20 s cap is the harness limit, not a runtime timer. Node.js, nginx and requests style libraries were not run._
### 6.2 Reading the table
Three points in the table matter more than the numbers.
First, the TTL you publish bounds only the clients on the first line of each group. In the lab, Python, Go and per request curl moved in about 2 seconds, and that figure was set by the resolver’s 2 second TTL, not by anything the clients choseM. For Java and long lived curl, the number that decides your cutover is a client setting you may not know existsO.
Second, the same runtime is two behaviors once you add a setting. Java went from 26.66 seconds to 1.68 seconds to no switch in 45 seconds on one propertyM. That property can be set by an application, by a base image, or by a platform team in a file you never opened. If you cannot name the value in effect for each service, you do not know your cutover timeO.
Third, a table like this is a measurement of a build. Java’s documentation promises an implementation dependent period, so other builds and other vendors may differ [1]S. We ran one. The Go and Python rows are equally for the one build each. Print the version next to the number when you test your own.
> **Common trap**
>
> Lowering the TTL to 60 seconds and calling the change “propagated in a minute” is a statement about your resolver. The clients in the second group will not notice. Measure the last client to switch, not the first, and measure it through the runtime and settings your services actually use.
### 6.3 The path from change to the last client
The diagram below puts the cases on one path. The record changes at time zero. The resolver’s copy expires after its own TTL, and from there the paths differ. The fast group asks again on the next request. The Java and long lived curl clients ask only when their own cache has expired, and Java with −1 did not ask within 45 seconds.

_Figure 6.1. From record change to the last client switching. The slowest path in this lab was not the resolver at 2 s but a client cache of 30 to 60 s, and one setting did not switch within the 45 s run._
An open connection is a further layer we did not measure. Every request in the runtime test used a new connection, so those numbers say nothing about a client that holds one connection for hoursM. The only statement we can make is a vendor’s: Microsoft’s documentation says existing connections are not affected by DNS changes [25]S. We read that as a limit of what DNS can do, not as a measured fact about any runtime. Test a keepalive client of your own before assuming it follows the recordO.
### 6.4 When the first address is dead
A change in an address is half the problem. The other half is what a client does when a name has two addresses and the first one does not answer. A multi address record set looks like redundancy. Whether it is depends on how the client walks the listO.
We tested two ways of being dead. A refused address answers each connection attempt with an immediate reset. A blackholed address drops every SYN and says nothing. The dead address was listed first and a live one second, with a record TTL of 60 seconds, one request per case, in both runsM. We also tested a dual stack name with a dead AAAA and a live A.
#### 6.4.1 Refused is cheap, blackhole is not
With a refused first address, Python, Go in both modes and curl reached the second address within about a quarter of a second: 0.01, 0.0, 0.0 and 0.22 secondsM. The curl figure includes process start. A reset costs one round trip, so any client that walks the list can afford to try the next address.
A blackholed address costs a timeout, and this is where the runtimes differ:
- Python with a 3 second connect timeout connected to the live address at 3.02 seconds. It waited out one timeout and then tried the second addressM.
- Go in both modes reached the live address at about 2.0 seconds with a 3 second timeout and at about 15 seconds with no timeout setM.
- curl reached it at 2.52 seconds with a 3 second timeout and 11.01 seconds with noneM.
We did not investigate why Go and curl took 2.0 and 2.5 seconds with a 3 second timeout. With no timeout passed by our harness, Go’s dialer used its own 30 second default and reached the live address after 15.01 seconds. The dial deadline may be shared by the two addresses, which would explain the 15 seconds, but we did not test that. curl took 11.01 seconds for a reason we did not investigateM. Without an explicit connect timeout, a dead first address can cost a client between ten and fifteen seconds in these two runtimes, and the number is not one you chose.
Python without any timeout set had not connected to the live address within the 20 second cap of our harnessM. That limit is the harness, not a Python or kernel timer. The accurate wording is that Python waits, and we cannot say how long.
#### 6.4.2 Java did not try the second address
OpenJDK 21.0.13 with `HttpURLConnection` did not reach the live address in any of the three IPv4 cases. With the first address refused, it failed with a `ConnectException` after 0.01 seconds. With the first address blackholed, it failed with a `SocketTimeoutException` at 3.02 seconds under a 3 second timeout, and had no success within 20 seconds with the defaultM. The harness expected a fallback in all three, so these are the only IPv4 failures in this test apart from the Python no timeout caseM.
The limit is firm. This is one JDK build and one HTTP API. It is not a statement about all Java, about other HTTP clients on the JVM, or about `HttpClient`, which we did not run. The address order the client used was the order we listed, with the dead address firstM. The finding is that this client, in this setup, gave up where the others went on to the next address. If your service uses Java for outbound calls, test it, because a second record is not redundancy until a client has used itO.
#### 6.4.3 Dead IPv6, live IPv4: Go and curl moved on, Python waited
RFC 8305 describes the staggered attempt that addresses the problem for a dual stack name. It sets a 50 millisecond resolution delay and a default 250 millisecond connection attempt delay, with a minimum of 100 ms and a maximum of 2 seconds, and it interleaves address families [29]S. With a dead AAAA and a live A, Go in both modes and curl reached the live address in 0.0 to 0.31 seconds across all nine cases, refused or blackholed, with or without a timeoutM. They passed the harness expectation of a live family within 2 seconds, which is the largest delay the RFC allows, so the result is consistent with RFC 8305. We did not isolate the 250 ms default, so we do not claim to have confirmed it.
Python showed no Happy Eyeballs behavior. It connected at 0.01 seconds when the AAAA was refused, at 3.02 seconds when the AAAA was blackholed under a 3 second timeout, and did not succeed within the 20 second cap with no timeoutM. That is a single 3.12.16 build, and the harness did not expect the feature. It is reported as found.
Java connected within 0.02 seconds in all three dual stack cases. We cannot count this as fallback evidence. The address order the client used listed the live address first, so it never met the dead oneM. A test that does not put the dead address first proves nothing about fallback, and ours did not here.
### 6.5 Composing the client term
Chapter 5 built cutover as a sum of terms, one of which was the client cache. This chapter supplies that term, and it behaves differently from the others: it is a maximum over your clients, not an averageO. If service A follows the resolver and service B holds a 30 second cache, the time until nobody uses the old address is B’sD.
For the lab, the arithmetic is short. The resolver contributed 2 seconds. Python, Go and per process curl added nothing measurable on top of that, so their last request on the old address came about 1.3 to 2.0 seconds after the changeM. Java at its observed default of 30 seconds counted from its first lookup could hold the old address for up to 30 seconds after a change that lands just after that lookup, and the long lived curl up to 60D. With a 60 second record TTL in front of those caches, the worst case could be the sum of both layers rather than the larger of them, because a client can fill its cache from a resolver copy that is nearly expired or from one that has just been refreshedD. We did not measure that stacked case. The runtime test used a 2 second TTL, so it shows the client cache on its own, not stacked on a long TTL.
The rows that were not run matter as much as those that were. Node.js, nginx, libraries that wrap Python’s HTTP stack, and a Java negative cache setting are all absent, and each is a place where your own services may differ from this tableM.
### 6.6 Prove it on your own services
The experiment is cheap, and it is the only way to learn what your build does.
1. Pick a name you control and give it a short TTL, such as 5 seconds, on the authoritative side. Lower it a full old TTL ahead of the test, so the resolver’s copy is not the thing you measureO.
2. Run each service or tool that calls it with a request loop that logs the address it actually connected to and a timestamp. Log the peer address of the socket, not the answer of a separate lookup, because the separate lookup bypasses the cache you want to testO.
3. Change the record to a second address you can see, and note the time.
4. Record when each client last used the old address. The largest value is your client term.
5. Repeat with the first of two addresses refused, then with it blackholed. Note whether a connect timeout is set and what it costs.
Do it once in a staging environment, with the settings your production image carries, and keep the numbers next to your declared cutover time.
### 6.7 What to do with this
The measurements argue for one small habit: for every service that calls a name you can change, write down the runtime, the build, the DNS cache setting in effect and the connect timeout, and compare the worst of those to the cutover time you promisedO. The Kubernetes DNS documentation gives a reason to look on pods in particular, since kubelet writes a resolv.conf with three search domains and `ndots:5` for each pod [30]S. We did not measure what that does to query counts, and chapter 7 covers search lists as a mechanism only.
If the table shows a runtime with a long cache, you have three options. Set the cache property to a value that matches your cutover budget. Shorten the connect timeout so a dead address costs seconds, not tens of seconds. Or stop depending on DNS for the cutover, and put the switch behind an address that does not change. Each costs something and we have not tested any of them in productionO.
> **Key takeaways**
>
> - Python, Go and per process curl followed the resolver within about 2.5 s in our lab. Java 21 (30 s observed), long lived curl (about 56 s) and Java with `cache.ttl=-1` (no switch in 45 s) did notM.
> - A second address is redundancy only if the client uses it. Java’s `HttpURLConnection` did not in our runs, and a blackholed first address cost between 2 and 15 seconds in Go and curlM.
> - Name the DNS cache setting and the connect timeout of every service, then compute the cutover from the slowest oneO.
## Chapter 7: Split-horizon, search lists and delegation traps
**Which setups make the same name mean different things to different clients, and which of them can you see from the zone file?**
Every chapter so far held the zone fixed and asked how long a copy of it lives. This one asks whether the copy is the one you meant. Three common setups produce answers the author of the zone never sees: split-horizon views, resolver search lists, and a delegation that lives in two places at once. We measured only the last, for two resolvers. The first two are described from documentation and reasoning, and we did not run them. The labels on each claim say which is which.
### 7.1 Where the author of the zone stops seeing
A zone file states what one server will say. It does not state which server a client asks, in what order, with what suffix appended, or which copy of the delegation the resolver trusts. The zone owner reads the file. The client sees the result of three other decisions. Figure 7.1 draws the first, and the rest of the chapter takes the other two.
#### 7.1.1 Split-horizon: one name, two answers
Split-horizon DNS serves different data for the same name depending on who asks, usually an internal address to clients inside a network and a public address to everyone elseD. The zone author sees two files that each look right. The failure sits between them. A resolver cache keys its entries by name and type, and RFC 2181 ranks cached data by where it came from, with authoritative answers above additional-section data [6]S. Nothing in that ranking records which view an answer belonged to (reasoning, not in any source we read). If one caching resolver serves both populations, whichever view asked first can fill the entry, and the other population receives it until the TTL runs outD.
This is reasoning from the cache model, not a finding. We did not build a split-horizon lab, so we have no measured leak, no leak duration and no count of resolvers that behave this wayD. What the reasoning does give you is a place to look: the number of distinct views that share one cache. The safe count is one per cache. Two views behind one cache is a configuration to remove or to prove otherwise, and the proof is a query from each side for the same name with a TTL longer than your test.

_Figure 7.1. One shared cache between two views. The inside client fills the entry first, so the outside client receives the internal address until the TTL ends. This is the cache model applied to split-horizon, not a measured result._
#### 7.1.2 Search lists: one short name, several queries
A resolver configuration can carry a search list, a set of suffixes appended to names that look short. The Kubernetes documentation shows an example pod `resolv.conf` with three search domains and the option `ndots:5`, and says the kubelet writes the file [30]S. The same short name can therefore reach more than one fully qualified nameD, and a name you meant as external may be tried against internal suffixes firstO.
There is no multiplication here. The Kubernetes page we read does not state the query count per lookup, and we ran no capture on a pod, so there is no number hereD. We also did not read the `resolv.conf` manual page for the exact rule on how `ndots` decides when a suffix is tried, so treat the sentence above as the consequence to check, not the rule. The check is cheap and is in the callout at the end of this chapter.
### 7.2 The delegation exists twice
A delegation is stored by the parent zone as NS records and again by the child as its own NS set. The two copies carry their own TTLs and can differ. A resolver that has both has to pick one. The standards leave room: RFC 9199 section 3.6.2 says resolvers may use the parent TTL, and tells operators to keep the old infrastructure running for the larger of the parent and child TTLs [13]S. Moura and co-authors measured the population in 2019 and found most resolvers child-centric and some parent-centric [12]S. That is a statement about resolvers on the internet in that year, not about any version you run.
The reason to care is migration. You move a zone to a new provider. You change the NS set at the parent, you lower the TTL there, and you shut the old servers down once the parent TTL has passed. If a resolver follows the child NS TTL instead, it keeps asking the old servers for as long as that TTL says, and the old servers are gone.
#### 7.2.1 Experiment E8: which TTL gets followed
We tested one thing: when the parent changes a delegation to a new server, how long does the resolver keep using the old server, and does that match the parent TTL or the child TTLM. The lab had three tiers (root, parent, child), each a scriptable authoritative server we wrote, so every statement below is about that lab and not about real top-level servers. The resolver started from root hints. We gave each case a fresh name, moved the delegation at the parent, and polled once a second until the answer came from the new server. The tolerance was −1.2 s to +1.5 s around either expectation, and we ran each case twiceM. The resolvers were Unbound 1.22.0 and BIND 9.20.30 [8]M.
| Resolver | Parent NS TTL | Child NS TTL | Switched afterM | Followed |
| --- | --- | --- | --- | --- |
| Unbound 1.22.0 | 6 s | 30 s | 30.2 s | child |
| Unbound 1.22.0 | 30 s | 6 s | 6.0 s | child |
| BIND 9.20.30 | 6 s | 30 s | 5.1 s | parent |
| BIND 9.20.30 | 30 s | 6 s | 29.1 s | parent |

_Figure 7.2. E8 in one picture. For each resolver, the case that hurts a plan which lowers only the parent TTL is in orange. Unbound waited for the child TTL in both cases, BIND for the parent TTL._
All four cases matched one of the two expectations. The two runs agreed to within 0.2 s on every case (for example 30.087 and 30.246 s for the first row). In this lab Unbound followed the child NS TTL and BIND followed the parent NS TTLM. The same change took either 5.1 s or 29.1 s on BIND and either 30.2 s or 6.0 s on Unbound, so the TTL you lowered mattered for one resolver and was ignored by the other.
The result is narrow. It covers two resolvers, two TTL pairs, one lab and one kind of authoritative server, and it is a statement about the NS TTL onlyM. We did not look inside either cache to find why they differ. Reading the RFC 2181 ranking, a resolver that trusts authoritative data over parent-supplied data would lean to the child’s copy, but that is our reading of the rule and not something we measuredD. We make no claim about other versions, other resolvers or real TLD servers.
#### 7.2.2 What follows for a migration
The lab numbers and the RFC 9199 advice point the same way. If you cannot know which TTL a given resolver follows, the old servers must keep answering for the larger of the twoS. Lowering only the parent TTL to 6 s shortened the switch on BIND and did nothing on Unbound, where the child’s 30 s still ruledM. So the plan is two TTLs and one deadline: lower both, wait out the old maximum, then move, then keep the old servers until the larger value has passed after the changeD.
Suppose the parent keeps the NS set at 48 hours and the child at 1 hour (example values, not measurements)D. A child-centric resolver that cached the old set just before your change can use it for up to 1 hour. A parent-centric one can use it for up to 48 hours. Shutting the old servers after 1 hour breaks the second population for nearly two days. The number to plan with is 48 hours, the larger value, and the cost of choosing the smaller is a slow, partial failure that no health check on the new servers will show, because the clients that fail are still asking the old onesD.
RFC 9199 gives one more rule for in-bailiwick name servers: their A and AAAA records should carry a TTL no longer than the NS TTL [13]S. A long address TTL under a short NS TTL leaves clients holding the old server address after the delegation has moved. We did not test it.
### 7.3 A signed delegation adds a third copy
DNSSEC puts a DS record at the parent that must match the child’s key. The operator controls the child, not the parent’s TTL. Slack’s engineering post about its 2021 DNSSEC rollout describes what that costs. When they rolled back, the DS record was already cached: the parent.com asks for 24 hours, and Slack observed Google Public DNS capping it at 6 hours. Validating resolvers returned SERVFAIL, so the rollback made things worse [20]S. The 6 hours is Slack’s observation about one record. It is not a documented clamp of that service, and the vendor pages we read state none.
We planned a DS cache arm for E8 (a signed zone, a validating resolver, a wrong re-sign) and did not run it. It needed signing tooling and a validating resolver setup that this round did not build, so this chapter has no measured DS duration, for any resolver. Slack’s lesson stands as Slack stated it: do not assume cache behavior. If you sign a zone, the rollback has a TTL you do not control, and the plan has to price that before the first change.
> A delegation or a DS record is a cache entry you do not own. Plan for the longest TTL anyone along the path may keep.
### 7.4 Reading your own delegations
You can look at both copies of a delegation without any lab. Ask a parent zone’s name server for your zone’s NS set, ask a child server for the same set, and compare names and TTLs. The standard `dig` tool does this with a non-recursive query to each serverO. Put three lines in your runbook before any migration:
- Whether the two NS sets are identical, name for name. Any difference is a population of resolvers that will see one set or the other.
- Both TTLs, and the larger of the two. That value is the earliest time the old servers can be shut downS.
- The TTL on the address records of any in-bailiwick name server, which RFC 9199 advises should not exceed the NS TTL [13]S.
If you control the child but not the parent, as with most domains under a registrar, the parent TTL is a number you read and cannot change. Plan with it as a fixed inputD. The DS record has the same property, which is why a signing change deserves a longer lead time than any other edit to the zoneO.
### 7.5 What was and was not measured
| Topic | Status | Basis |
| --- | --- | --- |
| Parent versus child NS TTL, two resolvers | MeasuredM | E8 method A, four cases, two runs |
| Split-horizon leak through a shared cache | Not runD | Cache model and RFC 2181 ranking |
| Search list query counts | Not runD | Kubernetes example `resolv.conf` only |
| DS cache duration after a wrong re-sign | Not runS | Slack’s account of one incident |
> **Prove it on one pod**
>
> Run `cat /etc/resolv.conf` inside one pod. Note the search domains and `ndots`. Then capture the queries for one external name and count how many it takes before the real answer arrives. Write the number next to this chapter, because we did not measure it.
> **Key takeaways**
>
> - The NS TTL a resolver follows can be the parent’s or the child’s. In our lab Unbound 1.22.0 followed the child and BIND 9.20.30 the parent, so keep the old servers for the larger value.
> - Split-horizon behind a shared cache and long search lists are reasoned risks here, not measured ones. Count views per cache and test one name from each side.
> - A DS record is cached outside your control. Slack’s rollback shows the cost, and no DS duration is measured in this paper.
## Chapter 8: Automation that writes DNS
**What stops a bug in your DNS automation from emptying a record, and what do resolvers do with the result?**
_In the model of chapter 1: the writer upstream of every clock._
Every chapter so far treated the zone as given. In production the zone is the output of software: a controller that reconciles records, an infrastructure-as-code run, a health check that removes an address. This chapter has no experiment of ours behind it. Every factual claim is sourced (S), derived from a source by arithmetic (D), or our opinion (O), and the tags say which. We did not build or run any DNS automation for this paper.
### 8.1 The case: automation racing itself
AWS’s summary of the 19 and 20 October 2025 event gives the root cause as a latent race condition in the DynamoDB DNS management system, which left the regional endpoint with no IP addresses [2]S. Its account is this. A delayed Enactor applied an old plan after a newer one had been applied, and the cleanup of old plans deleted that old plan. The system was left inconsistent, no Enactor could apply later plans, and operators had to repair it by hand. AWS disabled the Planner and Enactor automation worldwide until it was fixedS.
Read as a database problem, this is a lost update: two writers hold different versions of the desired state, nothing orders them at write time, and the stale one winsO. That is our reading, not AWS’s wording. Nothing in the summary says the design lacked an ordering check, and we do not claim to know the internals beyond what the summary states.

_Figure 8.1. The write path in the AWS case, with the guard we propose between the writers and the live record set. The fence rejects a plan older than the one already applied. The floor rejects a write that would leave the endpoint with no healthy address._
#### 8.1.1 The tail after the fix
AWS gives the DNS part of the timeline in PDT: DNS failures from 11:48 PM on 19 October, DNS information restored at 2:25 AM, and recovery at 2:40 AM once cached DNS records had expired [2]S. From those stamps, DNS-caused errors lasted about 2 hours 52 minutes, and about 15 minutes of that followed the restoration of the dataD. The summary does not split that 15 minutes into resolver caching and client behaviour, and we do not split it eitherS. It is one unit. The wider event ran to 2:20 PM on 20 October, and AWS says Network Load Balancer health checks flapped and automatic availability zone failover removed capacity until it was disabled at 9:36 AM and re-enabled at 2:09 PMS. A health check acted on a state that automation had already damaged.
### 8.2 Fail-open is a design choice
Two providers document the opposite of an empty answer. Route 53 says that when all records in a set are unhealthy, it treats them all as healthy instead of returning no answer [28]S. Azure Traffic Manager says that when all endpoints are degraded it responds as if all were online [25]S. Both are fail-open: when the checker has nothing good to point at, the service sends traffic to the endpoints it believes are badS.
That is a different failure from the AWS one. A health check that marks everything down is the checker doubting the targets, and these services have a rule for that case. A writer that deletes the record set is the control plane changing the data, and the checker’s rule does not apply. A fail-open check does not protect you from a bad write, and a bad write is not something a probe of the endpoints can see; a probe of the DNS answers canO.
### 8.3 Slack: the rollback is also a write
Slack’s account of 30 September 2021 is the other shape. Route 53 signed an NSEC record for a wildcard that omitted type information, some resolvers cached “no records of any type”, and A lookups failed for under 1 percent of users over about 24 hours [20]S. The rollback then made it worse. The DS record had been cached, the.com TTL asks for 24 hours, and Slack observed Google Public DNS capping it at 6 hours, so validating resolvers returned SERVFAIL after the rollbackS. The 6 hours is Slack’s observation about that one record, not a documented resolver setting. Slack’s stated lesson is not to assume cache behaviourS. We did not measure DS caching (it was not run, see Appendix A), so this stays Slack’s account.
The point for automation is that undo is a write with the same cache tail as the original change. A pipeline whose only recovery step is “apply the previous state” has not been shown to recover anything until someone has timed that step against real cachesO.
### 8.4 Guardrails (opinion)
None of the following is a finding (the whole table is opinion, tag O), and none was said by AWS or Slack. They follow from the shape of the two incidents, and we would want them in any controller, IaC pipeline or health-check hook that can write a record setO.
| Guardrail | What it does | Incident shape it addresses |
| --- | --- | --- |
| Version fence | Every plan carries a monotonic version. The writer applies it only if it is newer than the one last applied, checked at write time, not at plan time | A delayed writer applying an old plan after a newer one |
| Floor | Refuse any write that leaves an endpoint with no healthy record. A deletion pass may never remove the last one, and may not delete the plan in force | Cleanup removing the active state |
| Canary | Apply to one zone or one low-traffic name first, then compare answers from outside before the rest | A bad plan applied everywhere at once |
| Timed undo | Rehearse the rollback and time it against the TTLs and negative and DS caches in play | Rollback with its own cache tail |
A floor is cheap to write and a fence is not, because the fence needs shared state between the writers, and that is a design cost you pay onceO. The canary only helps if the check reads the answer a resolver would return, and chapter 9 lists what to watch for thatO. Every guard should fail closed on the write path (refuse and page a person) and open only on the data path, where Route 53 and Traffic Manager put itO.
> **What we did not measure**
>
> No experiment in this paper covers controllers, infrastructure-as-code or health-check hooks. We did not test any of the guardrails above, and we did not reproduce the AWS race. Of the four incident reports we read (AWS, Meta, Cloudflare, Slack), none turns its DNS caching into TTL guidanceS. That covers those four reports only.
> A fail-open health check protects you from your probes. It does not protect you from your writer.
> **Key takeaways**
>
> - The AWS summary describes automation that deleted the state it should have kept, and a 15 minute tail after the fix that it does not break downS.
> - Give every record writer a version fence and a floor, and rehearse the undo against real cache timesO.
## Chapter 9: Runbook: TTL policy, change plan, monitoring
**What do we set, what do we do before a change, and what do we alert on?**
_In the model of chapter 1: the one clock you control, set on purpose, and the others you watch._
This chapter turns the measurements into rules. Every number marked as ours comes from the lab described in the appendix: Unbound 1.22.0 and BIND 9.20.30 behind a scriptable test authoritative, run twice [8]M. Those numbers are lower bounds for a real cutover. The lab had no health checker, one host clock and emulated CPUs, so it measured cache expiry and nothing about detection time. Treat each rule below as a starting point to check against your own resolvers.
### 9.1 TTL policy
We start from the published advice and change it only where we measured. Table 9.1 is the policy. The ranges come from the sources, and the choice of a value inside a range is our opinionO.
| Record class | TTL | Basis |
| --- | --- | --- |
| General records (web, API, mail hosts) | 1 h or more | Moura et al. advise general zones to use at least 1 hour, and RFC 9199 gives the same floor with 4, 8 or 24 hours as better choices [12, 13]S. The longer TTL also cut one ccTLD’s median latency from 183 ms to 28.7 ms in their data [12]S. |
| NS and MX | 1 h to 1 day | Route 53 documentation gives 1 hour to 1 day for NS and MX [27]S. A delegation change waits out the larger of the parent and child TTLs (see the NS step below). |
| Health-checked failover records | 60 or 120 s | Route 53 documentation calls 60 or 120 seconds common for failover records [27]S. Moura et al. keep 5 to 15 minutes for load balancing and DDoS redirection only [12]S. A short TTL buys nothing until the check has fired (the cutover model in chapter 5)D. |
| TTL 0 | Avoid | Moura et al. do not recommend it [12]S. In our lab a TTL 0 record was not reused in either resolver (two cases), so a change was visible at once in both resolvers (E4)M. |
| Planned change | Lower first | Lower the TTL at least one old TTL before the change [4]S. Our measurement is in the next section (E5)M. |
| SOA negative TTL | Choose it | It is the time a missing name stays missing. After a failed lookup, a record we created right away stayed invisible for roughly the negative TTL in both resolvers (E2)M. Read it with `dig SOA` and pick it on purposeO. |
_Table 9.1. A TTL policy by record class. The ranges are sourced, the pre-change row and the last row are measured or derived here._
Two limits on the table. First, a TTL you publish is not the whole delay: client runtimes add their own caches (chapter 6). Second, the lab never tested a TTL above 20 s, so the table’s long values rest on the cited sources and not on our numbersM.
### 9.2 The change plan
Figure 9.1 is the order of work. Its first step is the one people skip.

_Figure 9.1. The plan has three phases around the change. Lowering the TTL late is the failure path, because the old copy is still cached for its full old TTL._
#### 9.2.1 Before: lower the TTL ahead
In our lab, with a 20 second TTL, lowering it to 2 seconds right before the change barely helped: the stale window stayed at about 18 to 19 seconds. Lowering it one full old TTL ahead cut the window to about 2 seconds in Unbound and under 1 second in BIND (E5)M [8]. In the ahead case the lab waited out the old entry and made one query so the resolver held the 2 s record before the change. A resolver that cached the record before you lowered the TTL keeps it for the old TTL, so the lowered value only helps caches that refresh after it.
While you wait, read two more numbers. The SOA negative TTL tells you how long a name that does not exist yet will keep saying so (E2)M. The parent NS TTL matters if the change is a delegation: the two resolvers disagreed on which NS TTL they follow. In a three-tier lab, Unbound 1.22.0 followed the child NS TTL and BIND 9.20.30 the parent NS TTL (E8, lab-mode)M. RFC 9199 tells operators to keep the old infrastructure for the larger of the twoS [13].
#### 9.2.2 At the change
Change the record and leave the old backend running. After the authoritative answer changes, a resolver in our lab kept serving the old address for about the remaining TTL, within 0.95 seconds of that arithmetic in Unbound and within 0.72 seconds in BIND, across TTLs of 3, 6 and 12 seconds (E4)M. Nothing you do at the authoritative shortens that remainder.
#### 9.2.3 After: wait for the slowest cache
The window after the change is the new TTL plus the longest client cache, so measure the clientD. In our lab a new Python, Go or curl process moved within about 2.5 seconds of a 2 second TTL, while OpenJDK 21.0.13 with default settings held the old address for about 30 seconds from its first lookup and a long-lived curl 7.88.1 process for about 56 seconds. With `networkaddress.cache.ttl` set to −1, Java did not switch within the 45 second run (E6)M. A worked example: a record at 3600 seconds is lowered to 60 an hour ahead. After the change, a client like the Java default adds about 30 seconds, so we plan for about 90 seconds and still check each client, because that sum is arithmetic and not an end to end measurementD.
A second address is not a safe substitute for waiting. When the first of two addresses was dead, Go, curl and Python reached the live one, but Python waited for its connect timeout on a blackholed address, and the Java HttpURLConnection client we tested failed instead of trying the second address (E7)M. Test your own clients before you rely on it.
When the answers agree from three resolvers and the slowest client has moved, restore the long TTL and retire the old backend. Doing it in this order, with the TTL raised last, is our ruleO.
### 9.3 Monitoring
Monitoring is the part we did not measure. These are opinions, with the lab result that motivates eachO.
| Watch | Why |
| --- | --- |
| The authoritative answer and the answers from three different resolvers, compared | The two resolvers we ran disagreed about the NS TTL (E8) and, with an unusual authoritative reply, about the negative TTL (E2, lab-mode)M. One resolver is one opinion. |
| Remaining TTL on a key record, sampled over time | A value that stays high after a change says a cache is holding the old copy. In our lab the remaining TTL predicted the cutover within about 1 second (E4)M. |
| NXDOMAIN rate for names that should exist | A new record stays invisible for the negative TTL (E2)M. A spike after a deploy is the signature. |
| SERVFAIL rate and a probe straight to the authoritative | With serve-stale on, our Unbound kept answering for about 20 seconds after a 5 second TTL with the authoritative down (E3)M. A probe through the resolver can stay green while the authoritative is gone. |
### 9.4 Before you change anything
> **Pre-change checklist**
>
> 1. Write the old TTL, the new TTL and the time you will lower it, one old TTL ahead of the changeO.
> 2. Run `dig SOA` and write the negative TTL. If the name does not exist yet, create it before anything looks it upD (derived from the negative TTL; E2 measured only the case that failed first).
> 3. For a delegation, write the parent and the child NS TTLs and keep the old servers for the larger oneS.
> 4. List your clients and write the longest cache you measured for each. Include any Java service and its `networkaddress.cache.ttl`M.
> 5. Name the three resolvers you will query afterwards, and what answer means doneO.
> **Do this week**
>
> Run `dig SOA` on your zone and write down the negative TTL. Pick one service that you may have to fail over and write its worst-case cutover next to your RTO, using the model with your own check settings. Change one record in staging and note when each client last reaches the old address.
> **Key takeaways**
>
> - Lower the TTL one old TTL before the change. Lowering it at the change barely helped in our lab (E5).
> - Plan for the slowest client cache, not the TTL. In our lab it was 30 s for one Java build and about 56 s for a long-lived curl, against a 2 s TTL (E6).
> - Monitoring is opinion here. Query more than one resolver and probe the authoritative directly.
## Chapter 10: Conclusion
If you keep one habit from this paper, keep the order of operations: find out what every cache between your zone and your users will do, then change the record. The rest is detail. This page covers what the evidence does not settle.
### 10.1 Where the lab stops
We measured two resolvers, Unbound 1.22.0 and BIND 9.20.30, and four client runtimes, behind a test authoritative we wrote ourselves [8]M. Every figure is a lower bound for a real cutover, because the lab had no health checker, no anycast, no middleboxes and no real latency. The number your users wait for during a failover includes the time your health check takes to notice, and we did not measure that. The model in chapter 5 gives you the shape of the sumD. Only your own check settings, your own resolvers and your own clients can fill it in.
The documented behaviour of PowerDNS Recursor, CoreDNS and dnsmasq came from their manuals, and we did not run them. The same goes for public resolvers: the vendor pages we read state no TTL clamp, negative cache duration or serve-stale policy (the Google performance page says only that zero-TTL answers and errors are not cached), and we did not test them. We would not guess either way. Appendix A lists every experiment that did not run and why.
### 10.2 What we would not trust yet
Two results arrived with a warning attached. The two resolvers followed different NS TTLs in our delegation test (E8)M, and they disagreed about a negative TTL when our test authoritative sent a reply a compliant one would not (E2)M. Both are lab-mode findings. They say what these two versions did with these replies. They are not a claim about either product in general, and a different version could behave differently. The useful conclusion is narrower: do not assume your resolver behaves like the one in the example you copied.
The same caution applies to the Java figures. One JDK build and one HTTP API failed to try a second address in our test (E7)M. That is a reason to test your own clients, not a rule about Java.
### 10.3 The harness is the contribution
The scripts, the raw records and the results file sit in the experiments directory of the paper source, and the whole suite ran twice with the same verdict on all 91 cases (maximum difference between runs 0.86 s)M. We would rather you rerun it against your resolver versions and tell us where it disagrees than take any number here on trust. A failing row in that suite is a finding, and we report it as one.
### 10.4 Next
Three experiments would change this paper most: a health checker in the loop to measure detection time, split-horizon views with a shared cache, and a signed zone to measure how long validating resolvers keep a bad DS record. They are listed in Appendix A as not run.
If you do one thing after reading this, do the first item in the box at the end of chapter 9: read the negative TTL of your zone and write it down.
## Appendix A: Method and limits
This appendix says what was measured and what was not, so that you can tell a finding from a gap.
### A.1 What ran
| Item | Value |
| --- | --- |
| Resolvers | Unbound 1.22.0 and BIND 9.20.30, default cache settings and tuned cache settings (a TTL floor of 15 s, a cap of 8 s, a negative cap of 3 s, serve-stale). |
| Resolver configuration | Not the products’ default configuration. Queries for the lab zone went straight to the lab authoritative through a stub zone (Unbound) or a static-stub zone (BIND). DNSSEC validation off (BIND `dnssec-validation no`, Unbound `module-config: "iterator"` with no validator), query name minimisation off, prefetch off (BIND `prefetch 0`, where BIND’s own default has prefetch on; Unbound `prefetch: no`), IPv6 off on the resolver side. The cache was restarted before each configuration and each case used a unique name. E8 started from root hints and used no stub zones. Where the text says default, it means default cache settings (TTL clamps, negative cap, serve-stale) inside this configuration. |
| Client runtimes | Python 3.12.16 (glibc 2.36), Go 1.23.12 (pure and cgo resolver), curl 7.88.1 and OpenJDK 21.0.13 (HttpURLConnection). |
| Authoritative | `dnslab.py`, a custom scriptable server in two reply modes for the SOA case. Not BIND, NSD or a production authoritative. Every claim about what an authoritative sends is lab-mode. |
| Host | Docker 29.8.2 on one arm64 laptop with 14 cores. All images linux/amd64 under emulation, so each timing carries a few hundred milliseconds of overhead. |
| Network | One internal Docker network with no route out and no published ports. One host clock, loopback-class latency. |
| Timing | Poll step: 0.2 s (E1, E2), 0.1 s (E4, E5), 1 s (E3 probe, E8), 0.5 s request interval (E6), one request per case (E7). Tolerance minus 1.2 s to plus 1.5 s where a tolerance applies. Two runs. Largest difference between runs 0.86 s, median 0.04 s. 79 of 85 evaluated cases matched the stated expectation, and 6 more were reported as found with no pass or fail [8]M. |
A failing row is a finding, not a harness error. The six rows outside tolerance are the two BIND cases of E2 with an unlowered SOA TTL, and four client cases in E7 (three Java, one Python).
### A.2 Experiment status
The ids follow the results file, which differs from the plan we wrote before running. The plan’s health-checker failover grid and its split-horizon experiment were not run, and the plan’s ids do not match the ones below, except E1 to E3.
| Id | What | Status | Detail and limits |
| --- | --- | --- | --- |
| E1 | TTL honored or clamped by the resolver | Run, 8 of 8 | Only TTLs of 5 and 20 s with default, floor and cap settings. The planned grid from 0 to 2147483647 s was not run. |
| E2 | Negative caching duration | Run, partial, 8 of 10 | Both resolvers agree behind a compliant authoritative reply. The two misses are BIND with an unlowered SOA TTL (lab-mode). NODATA, a SERVFAIL window, a reply with no SOA and the create-before-lookup control were not run. |
| E3 | Serve-stale during an outage | Run, 4 of 4 by the harness check, BIND serve-stale intermittent (11 ok, 2 failed, first failure at 5.02 s), not explained | A 5 s TTL and a 15 s stale window, default and serve-stale. Retry volume, a REFUSED outage and recovery lag were not run or are not citable. The harness check (last success between 17 and 22.5 s) cannot see intermittency, so the BIND serve-stale pass means only that its last success fell in the window. |
| E4 | Cutover after a record flip | Run, cache term only, 20 of 20 | TTLs of 0, 3, 6 and 12 s, flipped at 10, 50 and 90 percent. No health checker, so detection time was not measured. The planned failover grid is NOT RUN: no checker was built. |
| E5 | Stale window with the TTL lowered late or ahead | Run, 6 of 6 | Old TTL 20 s, new TTL 2 s. Not the experiment of the same number in the plan. |
| E6 | Client runtimes after a record change | Run, 9 of 9 | Python, Go (two resolver modes), curl (new process and long-lived) and Java (default, ttl 0, 5 and −1). Node.js, nginx, requests-style Python libraries and the Java negative cache setting were NOT RUN. curl has no command line option for its cache timeout, so only the 60 s default was measured. |
| E7 | Two addresses, the first dead | Run, partial, 20 of 24 | Refused and blackholed, v4 and dual stack. Four misses (Java 3, Python 1) and six dual stack cases reported as found. One JDK build, one API, one Python build. |
| E8 | Delegation NS TTL (method A) | Run, 4 of 4 | Parent 6 s and child 30 s, and the reverse. Method B (DS cache after a wrong re-sign, signed zone, validating resolver) is NOT RUN: it needs a signed lab zone with key rollover tooling and a validating resolver configuration, which were not built. |
### A.3 What was not measured
- Resolvers. PowerDNS Recursor, CoreDNS, dnsmasq and Knot Resolver were not run. Their behaviour in this paper comes from their documentation, with the page versions and access date given in the text.
- Public resolvers. No test was made against any public DNS service. The vendor pages read state no TTL clamp, negative cache duration or serve-stale policy; the Google performance page says only that zero-TTL answers and errors are not cached.
- Health-check detection. No health checker was in the loop. Every cutover number is the cache term only.
- Split-horizon, resolv.conf and search lists. Views with a shared cache, nameserver ordering, SERVFAIL and REFUSED handling and `ndots` query counts were not run. Chapter 7 describes the mechanisms only.
- DS caching. No validating resolver was tested, so no DS claim is measured.
- Keepalive connections. Every E6 request used a new connection. The statement that existing connections ignore DNS changes is the vendor’s, not a lab result.
- Real-world conditions. No anycast, no resolver farms, no ISP middleboxes, no loss or jitter. A lab figure is a lower bound for a real cutover.
### A.4 Threats to validity
One host clock and an emulated CPU add overhead to every figure. The poll step limits resolution (0.2 s in E1 and E2). The tolerance window is 2.7 s wide, so a pass on a 3 s or 6 s TTL means consistent with the rule, not equal to it. Each case ran once per run, twice in all, on one machine, so two agreeing runs give no variance estimate and do not show variation between hosts. E7 ran one request per case. The E5 ahead case includes an explicit refill query and is a confirmation of the arithmetic. The authoritative is our own code, and the reply shapes it sends decide some outcomes, as the two BIND cases of E2 show. Each resolver was tested at one version, and each client at one build.
## Appendix B: Checklists
Each list is a working copy. Items marked as opinion are our own rulesO, and the others point to the measurement behind them.
### B.1 Change plan
| Done | Step |
| --- | --- |
| | Write the old TTL, the new TTL and the time the TTL will be lowered. Lower it at least one old TTL before the change (E5)M. |
| | Read the SOA negative TTL of the zone. If the name does not exist yet, create it before anything queries it (derived from the negative TTL; E2 measured only the case that failed first)D. |
| | For a delegation change, write the parent and child NS TTLs. Keep the old servers for the larger of the two (E8, lab-mode)M. |
| | List each client runtime and the longest cache it holds. Check the Java `networkaddress.cache.ttl` setting (E6)M. |
| | Name three resolvers to query after the change and the answer that means doneO. |
| | Make the change. Keep the old backend runningO. |
| | Wait the new TTL plus the longest client cache. Query the three resolvers until they agreeO. |
| | Restore the long TTL. Retire the old backend lastO. |
| | Record the dates and the measured window next to the declared oneO. |
### B.2 Resolver configuration review
| Done | Step |
| --- | --- |
| | Which resolvers do your clients reach, and which versions? Write each one’s TTL floor and cap and its negative cap. Do not copy them from another version’s manualO. |
| | Is serve-stale on? If so, write the stale window and what a stale answer carries as its TTL (E3)M. |
| | Which NS TTL does each resolver follow after a delegation change, parent or child? Do not assume the answer is shared (E8, lab-mode)M. |
| | Does the resolver cap negative answers? A cap shortened a 20 s negative answer to about 3 s in both lab resolvers (E2)M. |
| | Do your monitors query the resolver, the authoritative, or both? A probe through a serve-stale resolver can stay green during an outage (E3)M. |
### B.3 Incident, first 15 minutes
| Done | Step |
| --- | --- |
| | Ask the authoritative directly. Does it return the record you expect? If not, the problem is in your zone or your automation, not in a cacheO. |
| | Ask three resolvers and write the remaining TTL on each answer. A high remaining TTL is a cache holding an old copyO. |
| | Is the answer negative? Read the SOA negative TTL. A name created after a failed lookup stays invisible for roughly that long (E2)M. |
| | Do not lower the TTL now and expect speed. Lowering a TTL at the moment of change barely shortened the window in our lab (E5)M. |
| | List the clients that hold their own cache and the longest each can hold. Restart those you cannot wait for, once the DNS answer is rightO. |
| | Write the time of each action. The incident record needs the order in which the caches expiredO. |
## Appendix C: Raw tables
These are the tables of the results file for the two runs, with the columns trimmed to those the text uses. The full records, including the per-case authoritative query counts and the run-by-run comparison of all 91 cases, are in the experiments directory of the paper source [8].
### C.0.1 E1. TTL honored or clamped (seconds)
unb is Unbound 1.22.0, bind is BIND 9.20.30. def is the default config. Tolerance: measured minus expected within −1.2 s to +1.5 s. Only TTLs of 5 and 20 s were run.
| Res. | Cfg | TTL | 1st reply | Expect | Measured | Delta | Pass |
| --- | --- | --- | --- | --- | --- | --- | --- |
| unb | def | 5 | 5 | 5 | 5.322 | 0.32 | yes |
| unb | def | 20 | 20 | 20 | 20.883 | 0.88 | yes |
| unb | min15 | 5 | 15 | 15 | 15.186 | 0.19 | yes |
| unb | max8 | 20 | 8 | 8 | 8.882 | 0.88 | yes |
| bind | def | 5 | 5 | 5 | 4.89 | −0.11 | yes |
| bind | def | 20 | 20 | 20 | 20.098 | 0.1 | yes |
| bind | min15 | 5 | 15 | 15 | 14.546 | −0.45 | yes |
| bind | max8 | 20 | 8 | 8 | 7.208 | −0.79 | yes |
### C.0.2 E2. Negative caching duration (seconds)
Tolerance as E1. Expected is min(SOA TTL, SOA MINIMUM), then the configured cap. The two failing BIND rows are the lab-mode finding of chapter 3: the test authoritative sent an unlowered SOA TTL on the wire.
| Res. | Cfg | Mode | SOA TTL | MIN | 1st TTL | Expect | Measured | Delta | Pass |
| --- | --- | --- | --- | --- | --- | --- | --- | --- | --- |
| unb | def | cap | 8 | 8 | 8 | 8 | 8.552 | 0.55 | yes |
| unb | def | cap | 30 | 6 | 6 | 6 | 6.942 | 0.94 | yes |
| unb | def | uncap | 30 | 6 | 6 | 6 | 6.917 | 0.92 | yes |
| unb | def | uncap | 60 | 6 | 6 | 6 | 6.95 | 0.95 | yes |
| unb | neg3 | cap | 20 | 20 | 3 | 3 | 3.643 | 0.64 | yes |
| bind | def | cap | 8 | 8 | 8 | 8 | 7.757 | −0.24 | yes |
| bind | def | cap | 30 | 6 | 6 | 6 | 5.939 | −0.06 | yes |
| bind | def | uncap | 30 | 6 | 30 | 6 | 29.869 | 23.87 | no |
| bind | def | uncap | 60 | 6 | 60 | 6 | 59.904 | 53.9 | no |
| bind | neg3 | cap | 20 | 20 | 3 | 3 | 2.279 | −0.72 | yes |
### C.0.3 E3. Serve-stale during an authoritative outage (seconds)
Tolerance: default, no success after 6.5 s. Serve-stale, last success between 17 s and 22.5 s. A first failure of 5.02 s for BIND with serve-stale is recorded as run and is not explained here.
| Res. | Cfg | Last ok | 1st fail | Stale | Stale TTL | Max fail ms | Pass |
| --- | --- | --- | --- | --- | --- | --- | --- |
| unb | def | 5.02 | 6.02 | no | - | 6009 | yes |
| unb | stale | 20.06 | 21.06 | yes | 30 | 6007 | yes |
| bind | def | 4.03 | 5.04 | no | - | 6016 | yes |
| bind | stale | 19.05 | 5.02 | yes | 30 | 6009 | yes |
### C.0.4 E4. Cutover after a record flip, cache expiry term only (seconds)
Tolerance as E1. Expected is the TTL minus the time since the cache fill. No health checker was in the loop.
| Res. | TTL | Flip at | Expect | Measured | Delta | Pass |
| --- | --- | --- | --- | --- | --- | --- |
| unb | 0 | 0.0 | 0.0 | 0.001 | 0.0 | yes |
| unb | 3 | 0.1 | 2.69 | 3.256 | 0.57 | yes |
| unb | 3 | 0.5 | 1.5 | 2.322 | 0.82 | yes |
| unb | 3 | 0.9 | 0.29 | 0.712 | 0.42 | yes |
| unb | 6 | 0.1 | 5.4 | 6.143 | 0.74 | yes |
| unb | 6 | 0.5 | 3.0 | 3.849 | 0.85 | yes |
| unb | 6 | 0.9 | 0.6 | 1.549 | 0.95 | yes |
| unb | 12 | 0.1 | 10.8 | 11.593 | 0.79 | yes |
| unb | 12 | 0.5 | 5.99 | 6.803 | 0.81 | yes |
| unb | 12 | 0.9 | 1.2 | 1.752 | 0.55 | yes |
| bind | 0 | 0.0 | 0.0 | 0.007 | 0.01 | yes |
| bind | 3 | 0.1 | 2.7 | 2.445 | −0.26 | yes |
| bind | 3 | 0.5 | 1.49 | 1.473 | −0.02 | yes |
| bind | 3 | 0.9 | 0.3 | 0.009 | −0.29 | yes |
| bind | 6 | 0.1 | 5.39 | 4.751 | −0.64 | yes |
| bind | 6 | 0.5 | 3.0 | 2.72 | −0.28 | yes |
| bind | 6 | 0.9 | 0.59 | 0.552 | −0.04 | yes |
| bind | 12 | 0.1 | 10.8 | 10.083 | −0.72 | yes |
| bind | 12 | 0.5 | 6.0 | 5.336 | −0.66 | yes |
| bind | 12 | 0.9 | 1.19 | 1.144 | −0.05 | yes |
### C.0.5 E5. Stale window after a change, TTL lowered late or ahead (seconds)
Old TTL 20 s, new TTL 2 s. Tolerance as E1.
| Res. | Mode | Expect | Measured | Delta | Pass |
| --- | --- | --- | --- | --- | --- |
| unb | base | 19.0 | 19.685 | 0.68 | yes |
| unb | late | 18.0 | 18.889 | 0.89 | yes |
| unb | ahead | 1.5 | 2.335 | 0.83 | yes |
| bind | base | 19.0 | 18.051 | −0.95 | yes |
| bind | late | 18.0 | 17.914 | −0.09 | yes |
| bind | ahead | 1.5 | 0.945 | −0.56 | yes |
### C.0.6 E6. Client runtimes: old address still in use (seconds after the change)
Record TTL 2 s, one request every 0.5 s, a new connection each time. Resolver: Unbound 1.22.0. Runtimes: Python 3.12.16, Go 1.23.12, curl 7.88.1, OpenJDK 21.0.13.
| Runtime | Variant | Client cache | Last old | First new | Reqs | Errs | Pass |
| --- | --- | --- | --- | --- | --- | --- | --- |
| python | fresh | none | 1.95 | 2.45 | 31 | 0 | yes |
| go pure | fresh | none | 1.46 | 1.96 | 31 | 0 | yes |
| go cgo | fresh | none | 1.46 | 1.96 | 31 | 0 | yes |
| curl | fresh | none | 1.26 | 1.76 | 31 | 0 | yes |
| curl | long | 60.0 | 55.16 | 55.66 | 151 | 0 | yes |
| java | def | 30.0 | 26.16 | 26.66 | 91 | 0 | yes |
| java | ttl0 | none | 1.18 | 1.68 | 31 | 0 | yes |
| java | ttl5 | 5.0 | 0.88 | 1.38 | 41 | 0 | yes |
| java | ttlinf | forever | 40.47 | none | 91 | 0 | yes |
### C.0.7 E7. Two addresses, the first dead (seconds)
Dead address listed first for v4, dead AAAA with live A for v6. Rows with no pass value had no expectation and are reported as found. curl time includes process start. Timeout none means no connect timeout was set, and the harness cap was 20 s.
| Runtime | Fam | Dead | Timeout | Outcome | Elapsed | Pass |
| --- | --- | --- | --- | --- | --- | --- |
| python | v4 | refused | none | ok live | 0.01 | yes |
| python | v4 | blackhole | 3.0 | ok live | 3.02 | yes |
| python | v4 | blackhole | none | cap 20 s | none | no |
| go pure | v4 | refused | none | ok live | 0.0 | yes |
| go pure | v4 | blackhole | 3.0 | ok live | 2.01 | yes |
| go pure | v4 | blackhole | none | ok live | 15.01 | yes |
| go cgo | v4 | refused | none | ok live | 0.0 | yes |
| go cgo | v4 | blackhole | 3.0 | ok live | 2.0 | yes |
| go cgo | v4 | blackhole | none | ok live | 15.02 | yes |
| curl | v4 | refused | none | ok live | 0.22 | yes |
| curl | v4 | blackhole | 3.0 | ok live | 2.52 | yes |
| curl | v4 | blackhole | none | ok live | 11.01 | yes |
| java | v4 | refused | none | ConnectExc | 0.01 | no |
| java | v4 | blackhole | 3.0 | SocketTimeout | 3.02 | no |
| java | v4 | blackhole | none | cap 20 s | 20.0 | no |
| python | v6 | refused | none | ok live | 0.01 | none |
| python | v6 | blackhole | 3.0 | ok live | 3.02 | none |
| python | v6 | blackhole | none | cap 20 s | none | none |
| go pure | v6 | refused | none | ok live | 0.0 | yes |
| go pure | v6 | blackhole | 3.0 | ok live | 0.31 | yes |
| go pure | v6 | blackhole | none | ok live | 0.3 | yes |
| go cgo | v6 | refused | none | ok live | 0.0 | yes |
| go cgo | v6 | blackhole | 3.0 | ok live | 0.31 | yes |
| go cgo | v6 | blackhole | none | ok live | 0.31 | yes |
| curl | v6 | refused | none | ok live | 0.01 | yes |
| curl | v6 | blackhole | 3.0 | ok live | 0.21 | yes |
| curl | v6 | blackhole | none | ok live | 0.21 | yes |
| java | v6 | refused | none | ok live | 0.02 | none |
| java | v6 | blackhole | 3.0 | ok live | 0.02 | none |
| java | v6 | blackhole | none | ok live | 0.01 | none |
### C.0.8 E8. Which NS TTL the resolver follows (seconds)
Polled once a second with fresh names. Both rows per resolver matched one of the two expectations. Lab-mode, three-tier lab of custom servers.
| Res. | Parent TTL | Child TTL | Switch | Follows | Pass |
| --- | --- | --- | --- | --- | --- |
| unb | 6 | 30 | 30.246 | child | yes |
| unb | 30 | 6 | 6.01 | child | yes |
| bind | 6 | 30 | 5.06 | parent | yes |
| bind | 30 | 6 | 29.138 | parent | yes |
## Glossary
**Authoritative server**: The server that holds a zone’s records and answers for them, as opposed to a resolver that caches answers for clients. In this paper’s lab it is a custom scriptable server, not a production authoritative.
**Clamping**: A resolver raising a TTL to a configured floor or cutting it to a configured cap before it caches the record. Measured in two resolvers in chapter 2.
**Cutover**: The time from “the old address stopped being right” to “users reach the new one”. In this paper it is the sum of detection, authoritative change, cache expiry and client behavior.
**Detection time**: How long a health checker takes to mark an endpoint down: probe interval times tolerated failures, plus the probe timeout.
**Delegation**: The NS records in a parent zone that say which servers answer for a child zone. Parent and child can carry different TTLs for the NS set.
**Negative caching**: Caching the fact that a name or type does not exist. RFC 2308 ties its duration to the SOA record [9].
**NODATA**: A reply that the name exists but has no record of the asked type.
**NXDOMAIN**: A reply that the name does not exist.
**Resolver**: A server that looks names up for clients and caches what it learns. Also called a recursive resolver.
**Serve-stale**: Answering from an expired cache entry when the authoritative servers cannot be reached. RFC 8767 describes it and its risks [11].
**SERVFAIL**: A reply that the resolver could not complete the lookup.
**SOA MINIMUM**: A field in the zone’s SOA record. RFC 2308 uses the lower of the SOA record’s own TTL and this field as the negative-caching time [9].
**Stub resolver**: The small resolver in a client’s operating system or runtime that forwards queries to a full resolver and may cache the answers.
**TTL**: Time to live. RFC 2181 describes it as a maximum time to live, not a mandatory one [6]. The zone administrator sets it, and RFC 1034 notes it may be lowered before an anticipated change [4].
## References
1. Oracle. InetAddress, Java SE 21 API. 2023.
2. Amazon Web Services. Summary of the Amazon DynamoDB Service Disruption in the Northern Virginia Region. 2025.
3. Renato Losio. AWS DynamoDB outage postmortem. InfoQ. 2025.
4. Paul Mockapetris. Domain Names: Concepts and Facilities. IETF. 1987.
5. Paul Mockapetris. Domain Names: Implementation and Specification. IETF. 1987.
6. Robert Elz, Randy Bush. Clarifications to the DNS Specification. IETF. 1997.
7. systemd project. systemd-resolved manual page. 2026.
8. GLINR Studios. GLINR-WP-2026-301 experiments and results. 2026.
9. Mark Andrews. Negative Caching of DNS Queries (DNS NCACHE). IETF. 1998.
10. Wessels, Duane, Carroll, William, Thomas, Matthew. Negative Caching of DNS Resolution Failures. IETF. 2023.
11. David Lawrence, Warren Kumari, Puneet Sood. Serving Stale Data to Improve DNS Resiliency. IETF. 2020.
12. Moura, Giovane C. M., Heidemann, John, Schmidt, Ricardo de O., Hardaker, Wes. Cache Me If You Can: Effects of DNS Time-to-Live. Proceedings of the Internet Measurement Conference (IMC). 2019.
13. Moura, Giovane C. M., Hardaker, Wes, Heidemann, John, Davids, Marco. Considerations for Large Authoritative DNS Server Operators. IETF. 2022.
14. NLnet Labs. unbound.conf manual. NLnet Labs. 2026.
15. PowerDNS. PowerDNS Recursor settings. PowerDNS. 2026.
16. CoreDNS. cache plugin. CoreDNS. 2026.
17. Kelley, Simon. dnsmasq man page. dnsmasq. 2026.
18. Internet Systems Consortium. BIND 9 Administrator Reference Manual. ISC. 2026.
19. Internet Systems Consortium. BIND 9.20 Administrator Reference Manual, Tuning. 2024.
20. Slack Engineering. What happened during Slack's DNSSEC rollout. 2021.
21. Meta Engineering. More details about the October 4 outage. Meta. 2021.
22. Cloudflare. Cloudflare 1.1.1.1 incident on July 14, 2025. Cloudflare. 2025.
23. Cloudflare. 1.1.1.1 FAQ. Cloudflare. 2026.
24. Google. Google Public DNS, Introduction. Google. 2026.
25. Microsoft. Azure Traffic Manager endpoint monitoring. Microsoft Learn. 2026.
26. Amazon Web Services. How Route 53 decides a health check is healthy. Amazon Route 53 Developer Guide. 2026.
27. Amazon Web Services. Best practices for Amazon Route 53 DNS. Amazon Route 53 Developer Guide. 2026.
28. Amazon Web Services. How Route 53 averts failover problems. Amazon Route 53 Developer Guide. 2026.
29. David Schinazi, Tommy Pauly. Happy Eyeballs Version 2: Better Connectivity Using Concurrency. IETF. 2017.
30. Kubernetes. DNS for Services and Pods. The Kubernetes Authors. 2026.